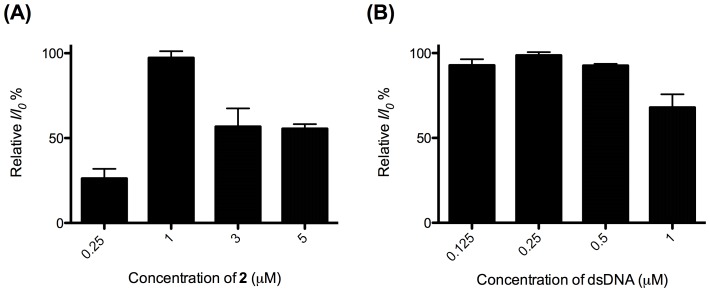
Figure 8. Relative luminescence intensity of the system (A) ([dsDNA] = 2 µM, [ATP] = 5 mM) in the presence of different concentrations of complex 2 (0.25, 1, 3 and 5 µM) in aqueous buffered solution (50 mM Tris, pH 7.2). (B) ([complex 2] = 1 µM, [ATP] = 5 mM) at various concentrations of the dsDNA (0.25, 0.5, 1.5 and 3 µM) in aqueous buffered solution (50 mM Tris, pH 7.2).
Error bars represent the standard deviations of the results from three independent experiments.

