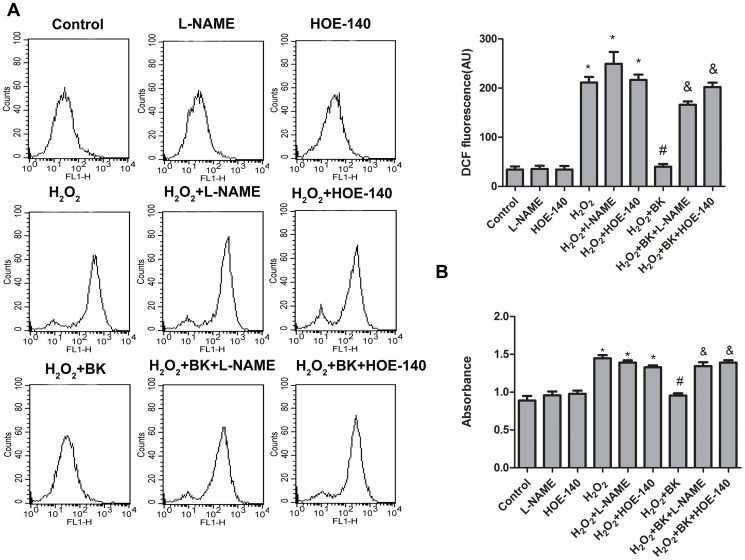
Figure 5. Effects of BK on ROS production in H9C2 cells treated with H2O2.
A, ROS generation was measured by the DCF fluorescence intensity. B, Superoxide generation was measured by the commercial available kit. Bars represent means ±SEM (*P<0.05 vs control; # P<0.05 vs H2O2; & P<0.05 vs H2O2+BK; n = 6).

