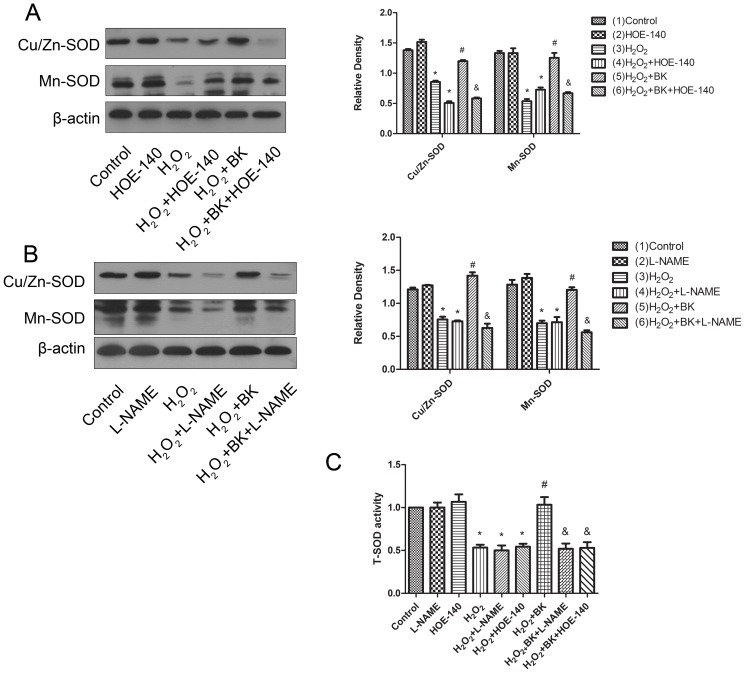
Figure 6. Effects of BK on SOD expression and activity in H9C2 cells treated with H2O2.
A, Effects of HOE-140 on the beneficial effects of BK on SOD expression in H9C2 cells treated with H2O2. B, Effects of L-NAME on the beneficial effects of BK on SOD expression in H9C2 cells treated with H2O2. C, Effects of HOE-140 and L-NAME on the beneficial effects of BK on total SOD (T-SOD) activity in H9C2 cells treated with H2O2. Bars represent means ±SEM (*P<0.05 vs control; # P<0.05 vs H2O2; & P<0.05 vs H2O2+BK; n = 3 experiments).

