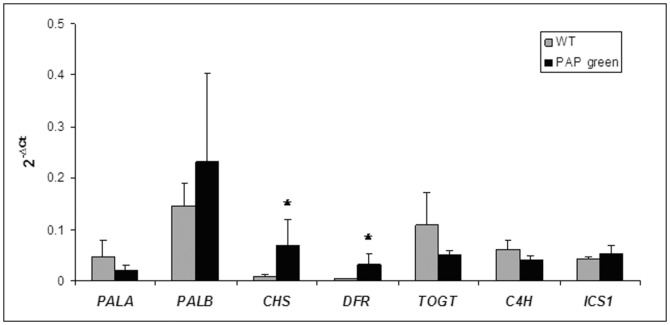
Figure 1. Molecular characterization of WT and PAP transgenic plants.
The expression level (2−ΔCt means) of genes in the phenylpropanoids pathway in WT (gray bars) and PAP green (black bars) plants. Asterisks indicate significant differences at P≤0.05. Error bars represent standard error of the means.

