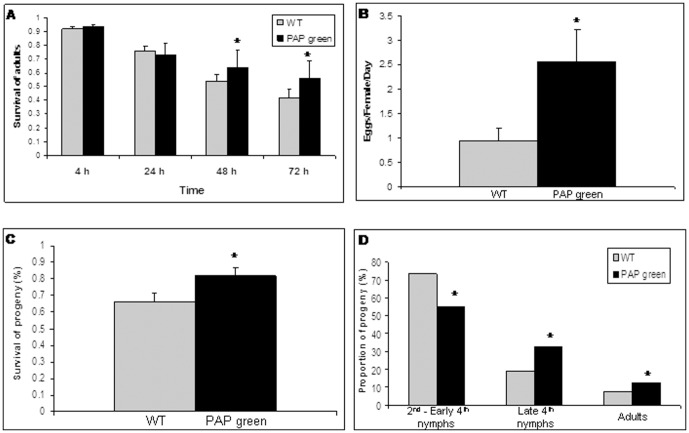
Figure 2. No-Choice performance experiments on WT and PAP green plants.
A) Proportion of surviving adults on WT (gray bars) and PAP green (black bars) plants over a period of 72 h. B) The mean daily number of oviposited eggs per female on WT (gray bars) and PAP green (black bars) plants. C) The mean survival of progeny on WT and on PAP green plants. D) The proportion of progeny that had reached different stages of development (2nd to early 4th nymphs, late 4th nymphs and adults) at day 18. Asterisks indicate significant differences (P≤0.05) between WT and PAP green plants. Error bars represent standard error of the means.

