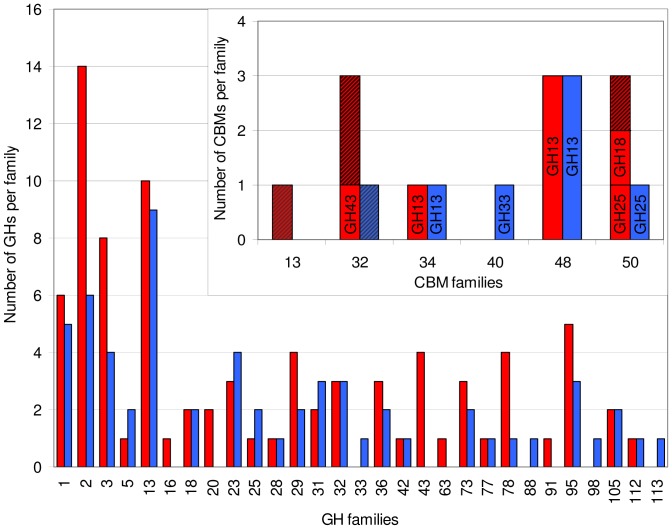
Figure 1. Comparison of the distribution of GHs and CBM between R. gnavus E1 and ATCC 29149.
GHs and CBMs are represented by red boxes for R. gnavus E1 and by blue boxes for R. gnavus ATCC 29149. CBMs associated with GH are represented by plain boxes, with the GH family indicated inside the box. CBMs not associated with GH are represented by striped boxes.

