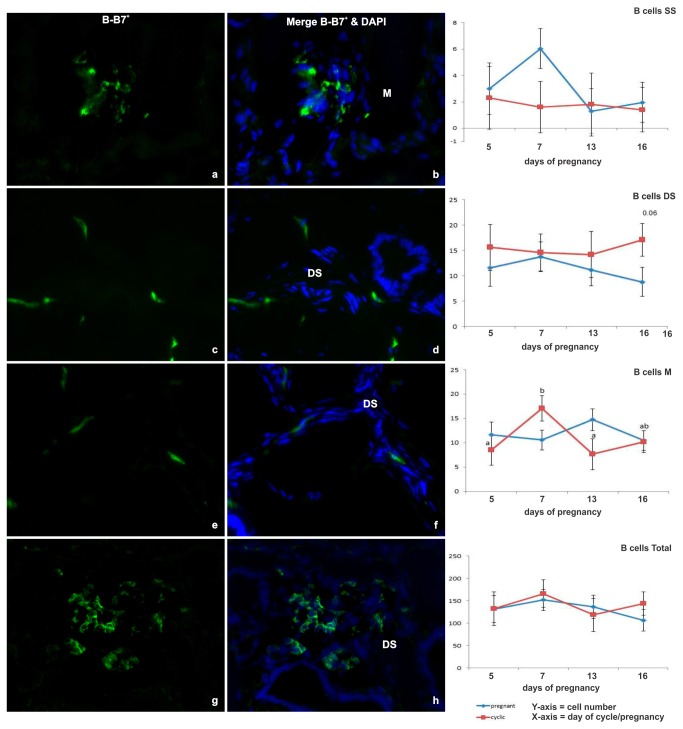
Figure 1. Immunofluorescent labeling of endometrial tissue for B cells.
(a-h) Representative images of immunofluorescent B cells+ (B-B7) labeling (green) in cells (nuclei labeled with DAPI [blue]), in the endometrial myometrium (M) and deep stroma (DS) of cyclic (C) heifers on Day 7 & 16 and in the DS from pregnant (P) heifers on Day 7 & 16 (original magnification X40). (i-l) Line graphs detailing the total number of B cells in cyclic (red line) and pregnant (blue line) endometrial tissue based on the sum of immunofluorescent labeled cells per 2.25 mm2 field of view, in all areas (total B-B7+ cells) and specifically in the shallow stroma (SS), DS and M. Values plotted are least squared means and standard errors across 5 replicate animals per timepoint and per status.

