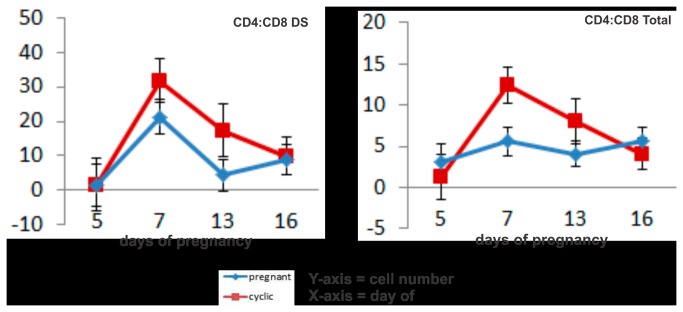
Figure 3. Line graphs detailing the CD4 :CD8 ratio in cyclic (red line) and pregnant (blue line) endometrial tissue.
Values plotted are the ratio of least squared means and standard errors of immunofluorescent labeled cells per 2.25 mm2 field of view, specifically in the deep stroma (DS) and the sum of immunofluorescent labeled cells per 2.25 mm2 field of view, in all regions (total cells) across 5 replicate animals per timepoint and per status,.

