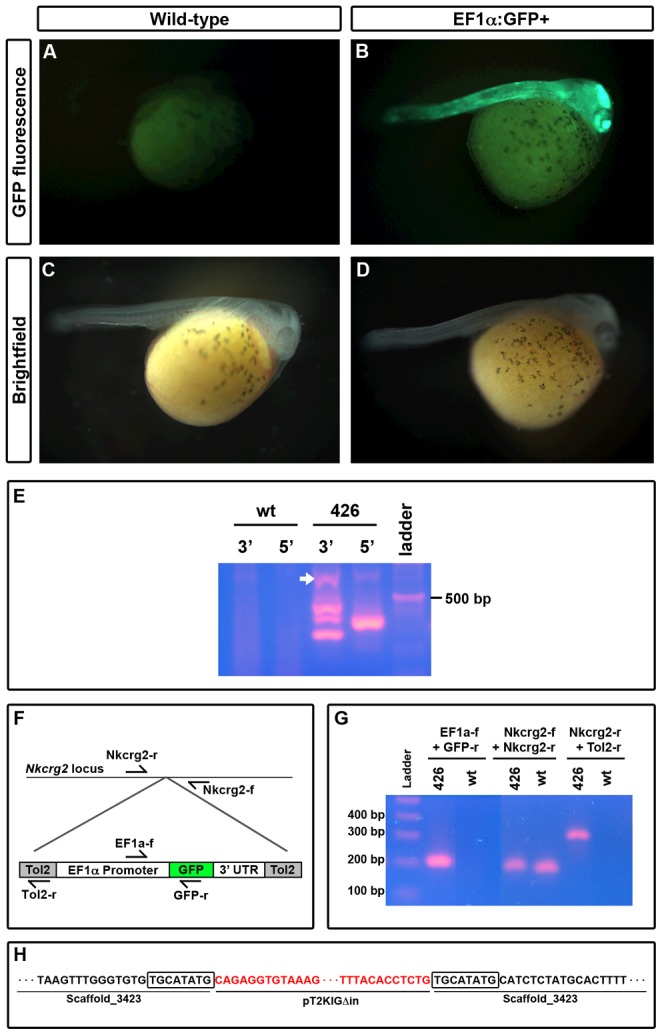
Figure 3. GFP expression and genetic analysis of EF1α:GFP line 426.

Transgenic 4(B), while a wild-type sibling does not (A). Brightfield images of the larvae depicted in A and B are provided for comparison (C, D). E) Splinkerette nested PCR amplifies region surrounding transgene insertion site with primers in the splinkerette adapter (Splink3, Splink6), combined with primers at either the 5′ (Tol2-r, Splink7) or the 3′ (Splink5, Splink8) end of the transgenic construct. All bands were sequenced; arrow indicates band that provided sufficient quality sequence for mapping. F) Schematic of locations for primers in the Nkcrg2 locus and the integrated EF1α:GFP cassette. G) PCR from genomic DNA template of line 426 GFP+ fish and wild-type siblings demonstrating EF1α:GFP integration at the Nkcrg2 locus. H) Sequencing of PCR products shows that the EF1α:GFP cassette integrated on scaffold 3423. Sequence in red matches the Tol2 flanking region from pT2KXIG in, while sequence in black matches the A. burtoni genome. The boxed sequence is an 8 bp duplication of the genomic locus indicative of Tol2-catalyzed integration.
