
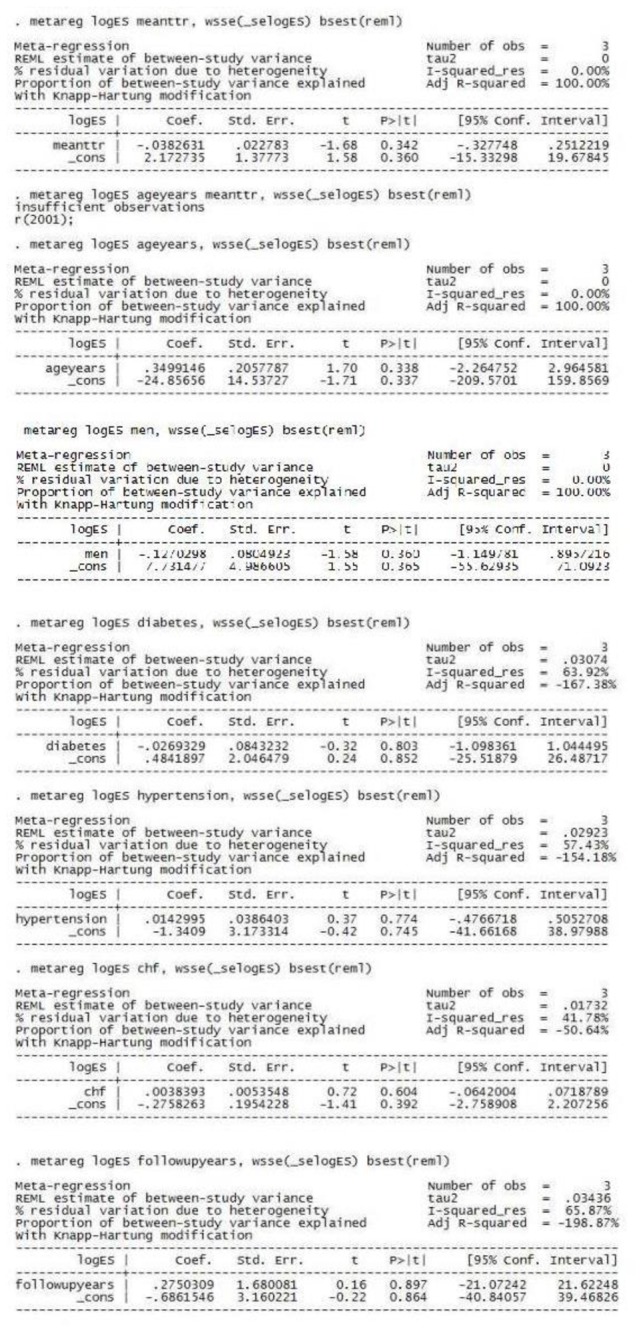
Figure 6. Meta-regression analysis for stroke (with following variables- mean time in therapeutic range, mean age, percentage of male population, percentage of patients with diabetes, hypertension, congestive heart failure and follow up duration).
Official websites use .gov
A
.gov website belongs to an official
government organization in the United States.
Secure .gov websites use HTTPS
A lock (
) or https:// means you've safely
connected to the .gov website. Share sensitive
information only on official, secure websites.