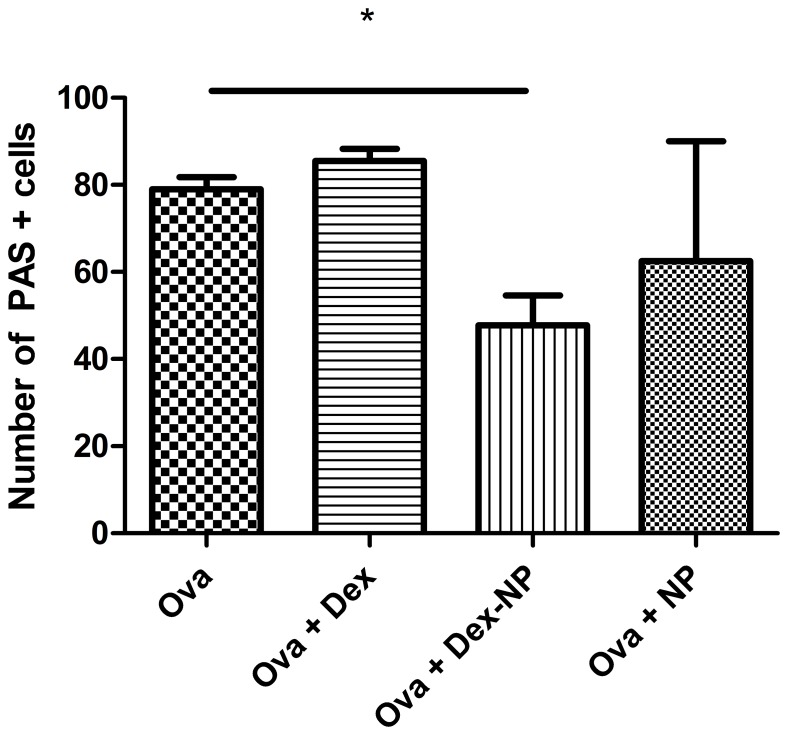
Figure 8. Number of PAS positive cells present in the airway epithelium among groups of mice exposed to Ova.
PAS staining of 5 µm-thick, left lobe lung sections from select mice in each experimental group and images and counting of cells was done at 400×magnification. Filtered air exposed mice displayed an average of <1% PAS positive cells in the airway epithelium. The total number of PAS stained cells were quantified in the generation airway immediately branching from the lobar bronchus. PAS cells were counted per 100 basal airway epithelial cell nuclei. The number of positive PAS stained cells was significantly lower in the Dex-NP group than either the Dex (47.8±6.8 (n = 4) vs. 85.5±2.7 (n = 4) respectively, p<0.05, Fig. 6) or the control group (47.8±6.8 (n = 4) vs. 79.0±2.8 (n = 4), p<0.05) among the Ova exposed groups. Data are presented as mean values±SEM. *denotes p<0.05 by Student’s T-test.

