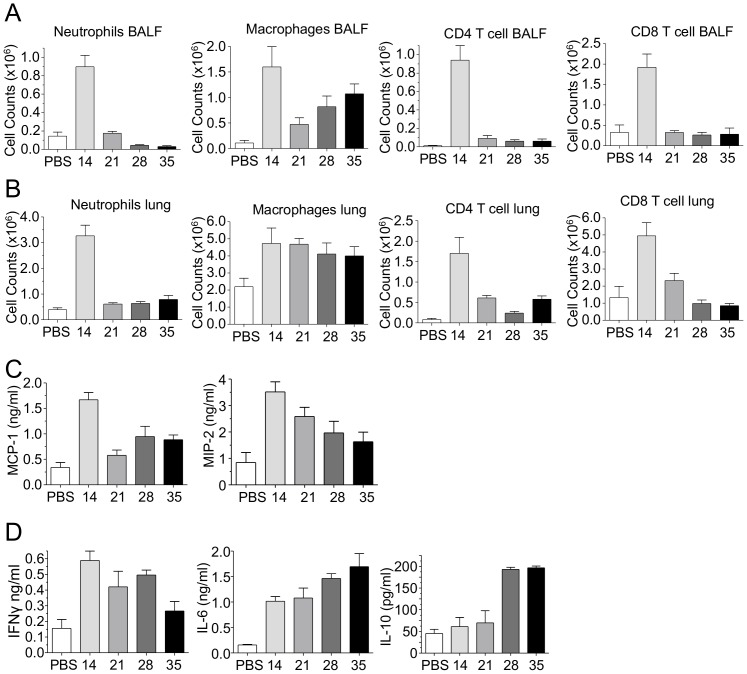
Figure 3. CP infection induced immune infiltrates and cytokines.
Immune cell counts in the A) BALF and B) lung were assessed at various time points after CP infection by flow cytometry. C) Chemokine production in lung homogenates after infection. D) Cytokine production in lung homogenates after infection. Data for all experiments shown represent at least two independent experiments (pooled together).

