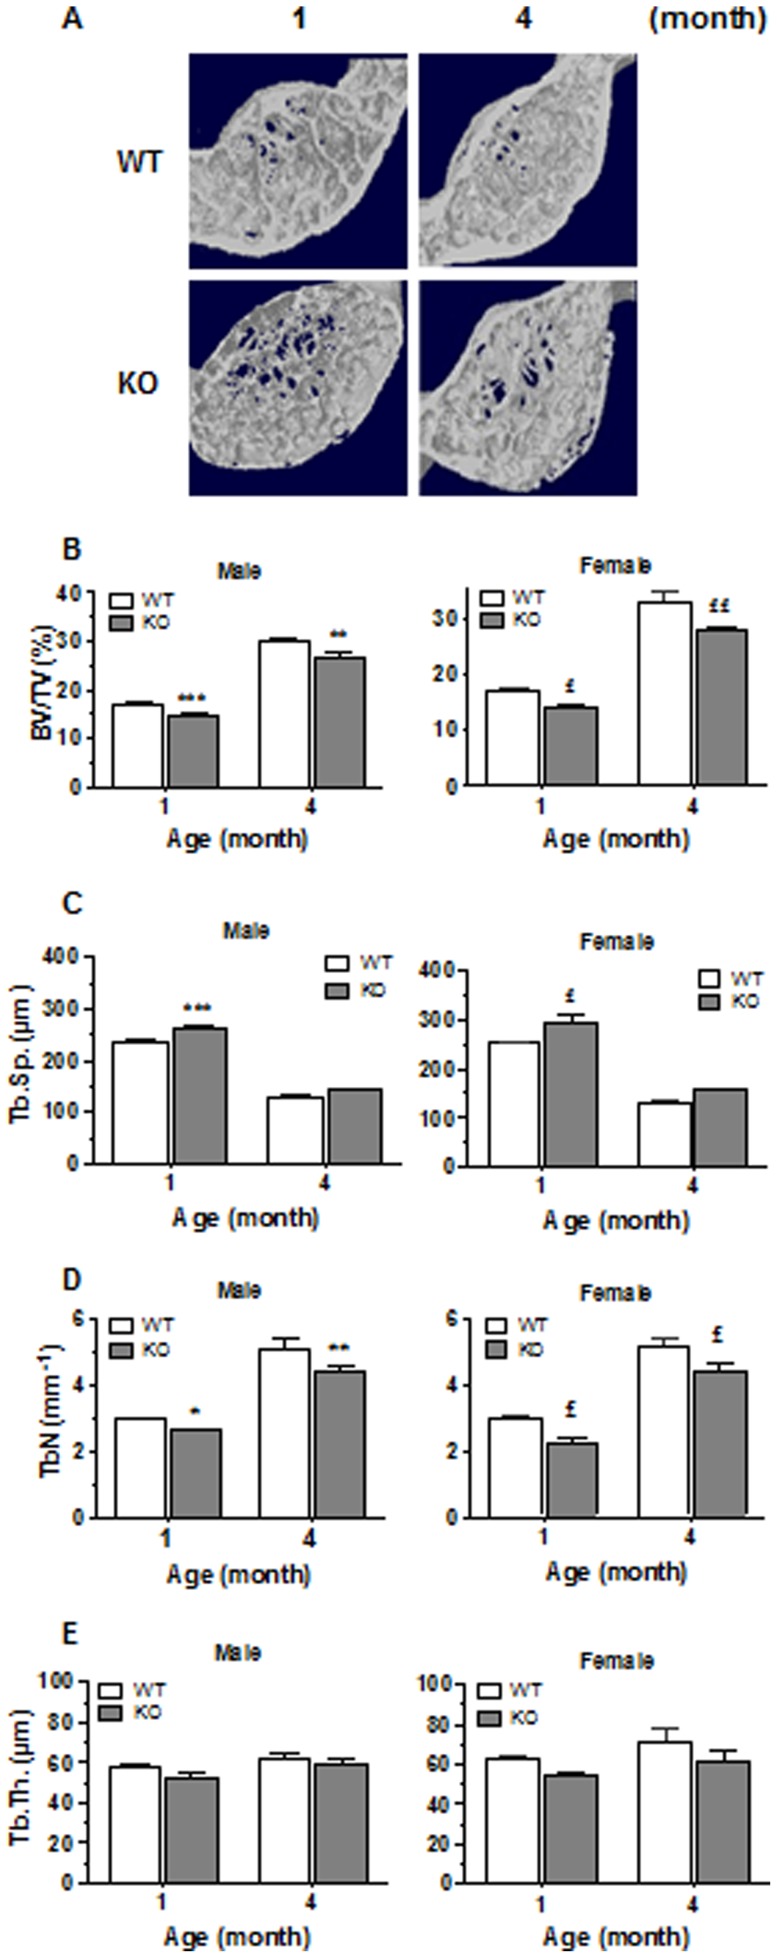
Figure 4. Microarchitecture analysis of vertebrae of WT and CD36KO mice.
(A) Representative 3D reconstructions of vertebrae of 1 and 4 month-old female mice. (B) Percent bone volume (BV/TV), (C) trabecular spacing (Tb.Sp.), (D) trabeculae number (Tb.N.) and (E) trabecular thickness (Tb.Th.) of vertebral from male and female WT and CD36KO mice. Values are means ± SEM from 5–18 mice per group of age. Bonferroni post-test: *P<0.05, **P<0.01 and ***P<0.001 compared to WT male; £P<0.05 and ££P<0.01 compared to WT female.

