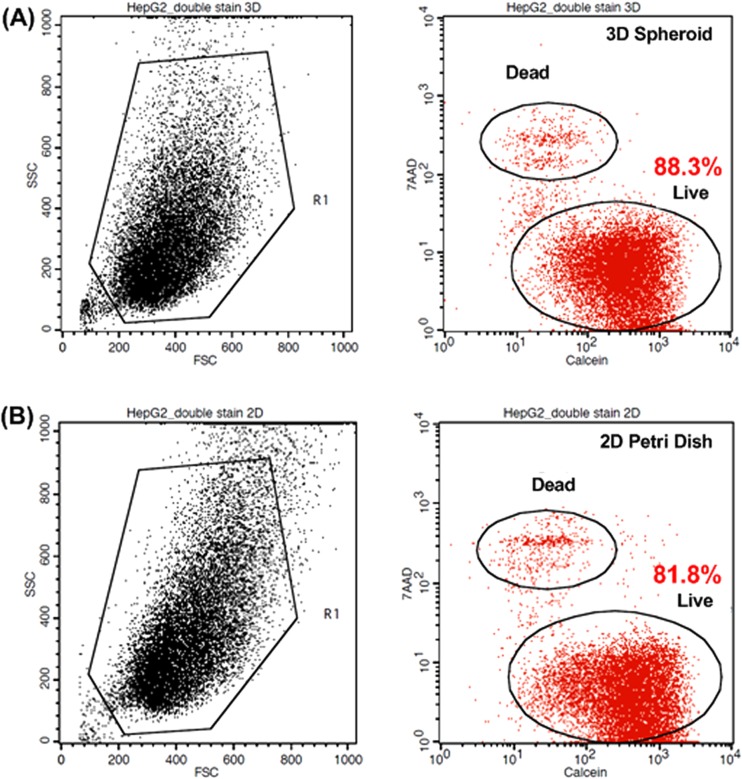
Figure 6.
(a) Flow cytometry analysis of dissociated HepG2 (without DsRed) spheroids. FSC, SSC plot and gate (left). Viability analysis using Calcein AM and 7-AAD (right) for HepG2 spheroids cultured for 3 days in the microfluidic device. (b) Flow cytometry analysis of HepG2 cultured in T75 flask for 3 days.

