
Figure 3. TGF-β1 dose-response and time-course effect on miR-1207-5p.
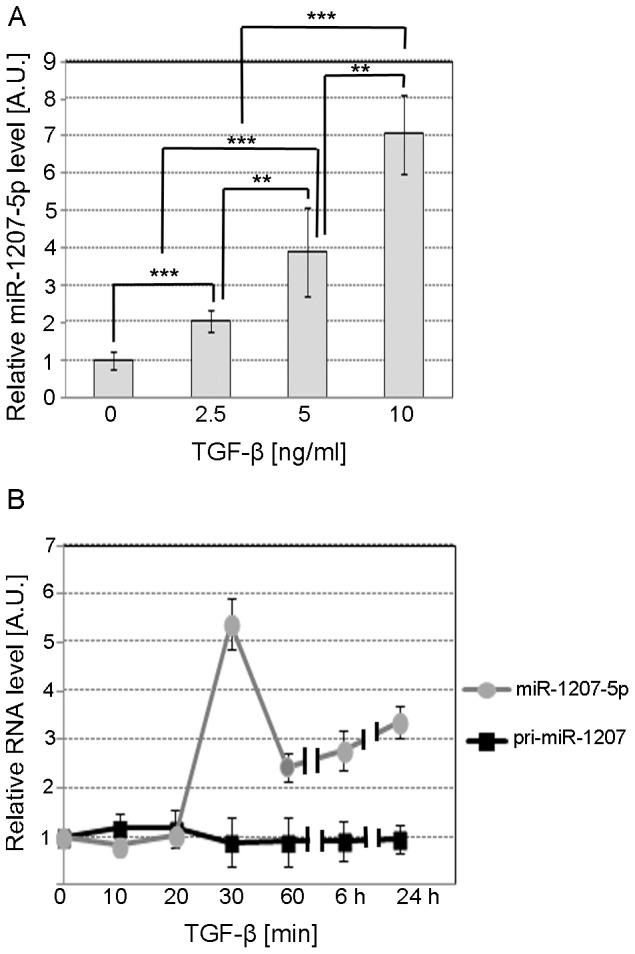
A. TaqMan qPCR relative quantification of miR-1207-5p in MC treated for 24 h with serum-free medium supplemented with 2.5, 5.0, or 10.0 ng/ml TGF-β1. B. Relative quantification of miR-1207-5p and pri-miR-1207 in MC treated for different times with serum-free medium supplemented with 10 ng/ml TGF-β1. RNU6B, UBC, and 18S RNA were used as endogenous controls. Results represent averages from three independent experiments. Data are means ± SD. A.U.: arbitrary units. The significance is indicated only for samples that are significant different from all the others. * P<0.05; ** P<0.01; *** P<0.001.