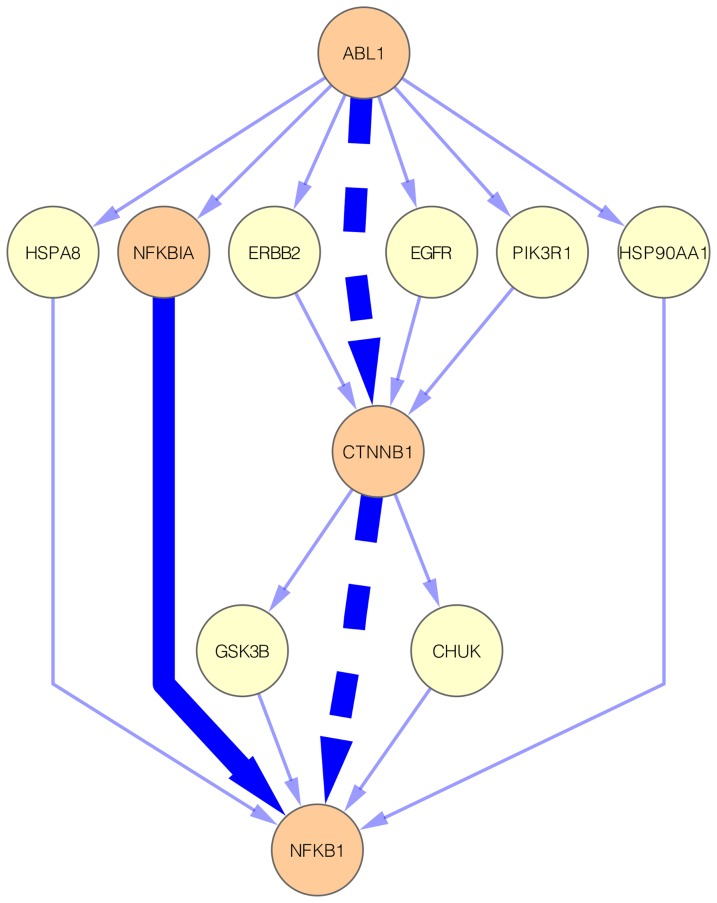
Figure 6. The ABL1  NFKB1 subnetwork.
This subnetwork contains 18 interactions. The highlighted solid edge represents the interaction presents in the corresponding OLP. The highlighted dashed edges represent the interactions of the potential oncogenic pathway (ABL1  CTNNB1
  NFKB1). Blue edges represent protein physical interactions and orange nodes represent genes participating in the known or potential oncogenic pathways.

