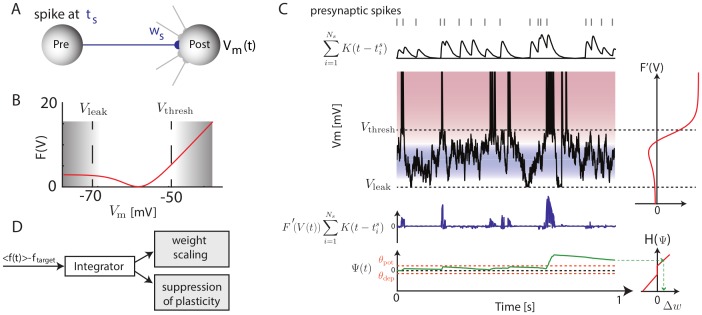
Figure 1. Illustration of the Convallis rule.
(A) Schematic of a particular plastic synapse (blue) onto a post-synaptic neuron with membrane potential  . (B) The objective function
  optimized by the neuron:
  values in between resting state or threshold are penalized, while values close to rest or spike threshold are rewarded. (C) Illustration of the learning rule. Presynaptic spike times (top, gray lines), are filtered by the EPSP shape
  (top black trace). This activity is multiplied by
  (shown to the right of
  ), to yield a function that is positive when the presynaptic cell fires shortly before
  is close to threshold, and negative for presynaptic spikes at intermediate
  (blue trace). This function is then accumulated through a slowly decaying exponential (
 , green, bottom), and passed through a shrinkage function
  (right) to yield the weight changes. The horizontal orange lines indicate the thresholds
  and
and  that
that  must cross to yield potentiation and depression. (D) Illustration of the rate constraint mechanism. Deviations of the long-run average firing rate from a target value lead to multiplicative scaling of excitatory synaptic inputs and suppression of activity-dependent plasticity until the rate target is restored.

