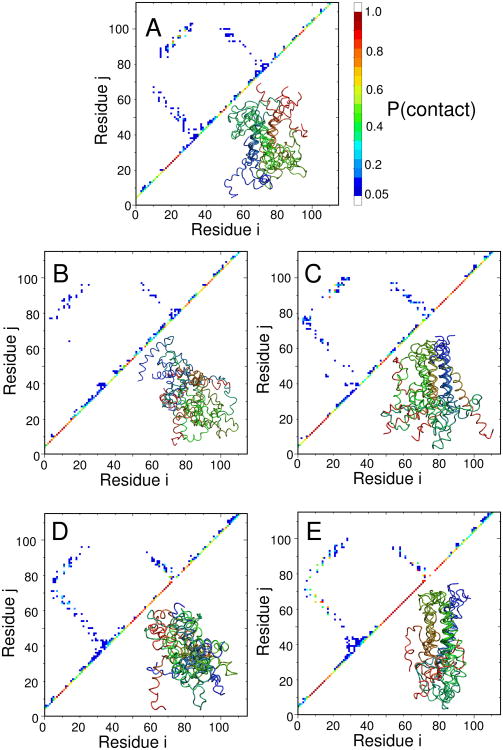
Figure 5.
Structures of putative transitions states: (A) R15 (Q = 0.5), (B) R16 early (Q = 0.39), (C) R16 late (Q = 0.55), (D) R17 early (Q = 0.46), (E) R17 late (Q = 0.63). All structures were drawn randomly from an equilbrium distribution at the specified Q-values for the Gō/KH model. For each transition state ensemble, an average contact map (upper left) and representative set of structures (lower right) are shown. Results for the pure Gō model are similar and are not shown for clarity (the R17 transition state in the Gō model is similar to the late R17 transition state in the Gō/KH model).

