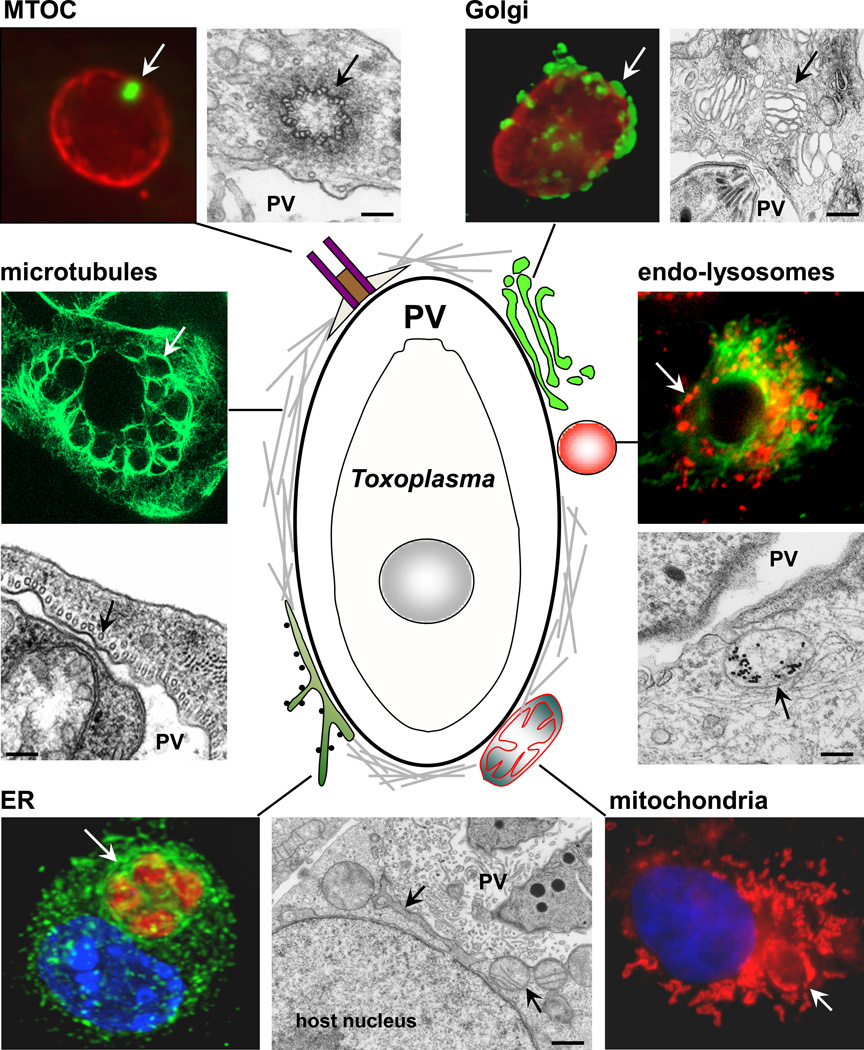
Figure 1. Model for the interaction of Toxoplasma gondii with host cells.
A schematic representation of the PV and the host cell structures that are recruited by the parasite is shown. These host cell-PV interactions are illustrated by immunofluorescence and electron microscopy images. Host structures are indicated by an arrow. The following antibodies and dyes used for staining are: anti-γ-tubulin for MTOC (green) and anti-GRA7 for the PV membrane (red); anti-giantin for Golgi (green) and anti-GRA7 (red); anti-α-tubulin for microtubules in a multi-infected cell; anti-calnexin for ER, anti-SAG1 for the parasite plasma membrane and DAPI for nuclei; mito-Tracker for mitochondria and DAPI; Texas-red EGF (red) for endo-lysosomes and anti-α-tubulin (green). EM picture shows an endocytic organelle containing LDL-gold particles. Scale bars are 150 nm.

