
Figure 2.
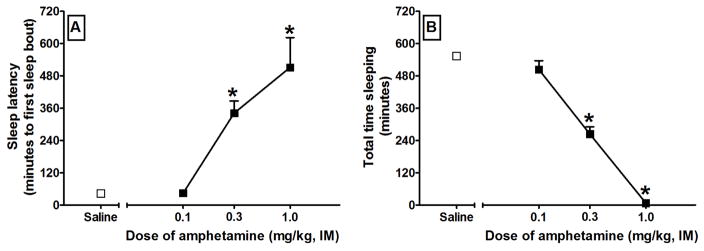
Effects of amphetamine on sleep in rhesus monkeys. All points represent the mean ± SEM, and any points without error bars indicate instances in which the SEM is encompassed by the data point. Abscissae: Dose of drug expressed as mg/kg and plotted on a logarithmic scale. The points at saline represent administration of the saline vehicle of amphetamine. Ordinates: Latency to the first sleep bout from the commencement of the dark phase (A) or total sleep duration over the entire dark phase (B). A * indicates a significant difference from saline treatment as assessed by Dunnett’s method.