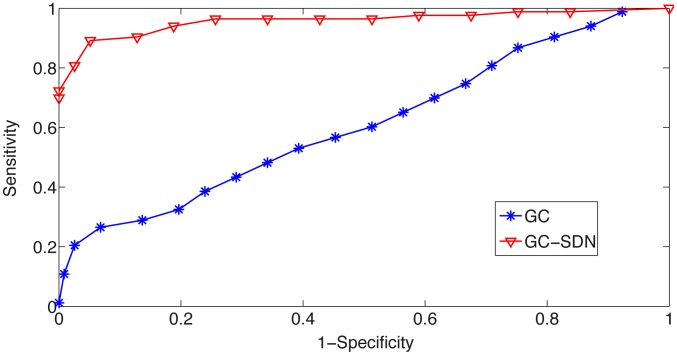
Figure 2. Comparison by simulations of the performance of the classical Granger causal analysis and the Granger causality with signal-dependent noise analysis by ROC (receiver operating characteristic) analysis.
The sensitivity of the methods is plotted against 1 specificity for different
  -value thresholds. The sensitivity is defined as the proportion of actual causal influences that are correctly identified. The specificity measures the proportion of non-causal influences that are correctly identified. By setting different
  -value thresholds for causality, each method gives different sensitivity and specificity. Therefore, the best model is expected to have its performance ROC curve go through the upper left corner, while a random classification algorithm has its performance curve as a diagonal line. The signal-dependent noise model outperforms the classical Granger causal model substantially and consistently.

