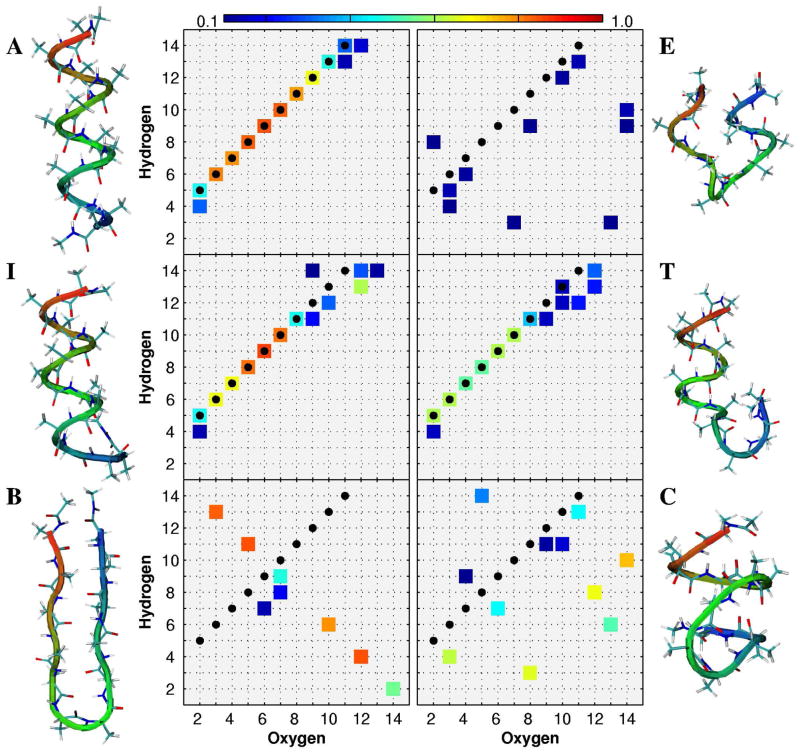
Figure 4.
Probability of formation for different sets of hydrogen bonds in the states labeled in Figure 3. The black dots represent the hydrogen bonds formed in the folded (helical) state, as a reference. Representative configurations for each state are shown next to the corresponding hydrogen bond map.

