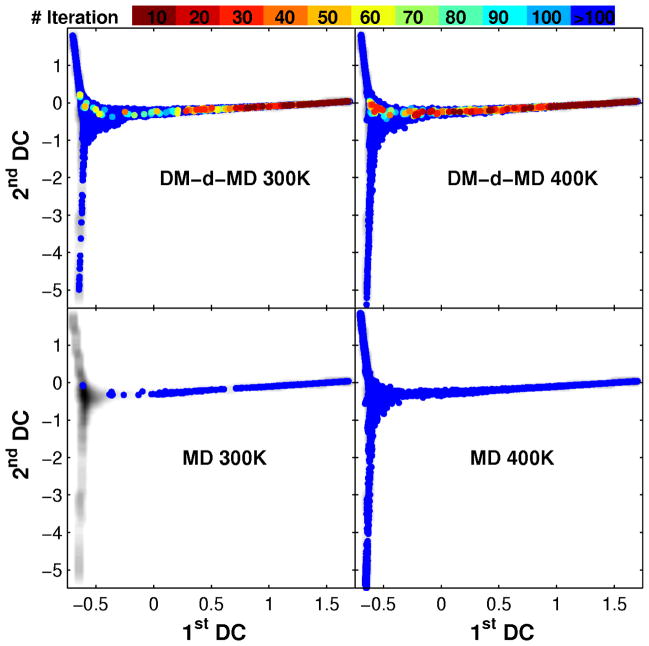
Figure 5.
DM-d-MD sampling of alanine-12 configuration space projected onto the LSDMap space of the system at 400K. Top: DM-d-MD results; bottom: Classical MD results; left: 300K; right: 400K. The DM-d-MD iteration number of each point is given by the color. The grey shades underlying each of the four panels correspond to the free energy obtained from equilibrium MD simulation at 400K.

