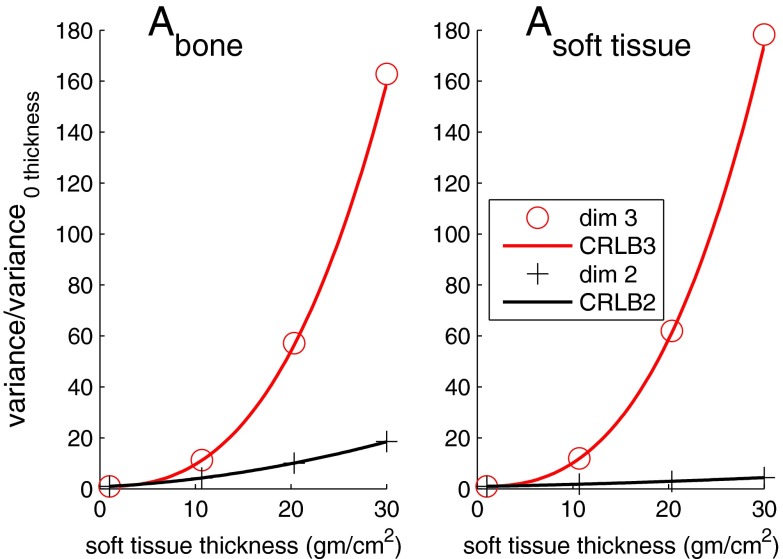
Figure 11.
Noise variance in the images in Fig. 10 as a function of soft tissue slab thickness. The variance of the image data within the soft tissue excluding the regions where bone and adipose tissue blocks overlap is used. The image data sample variances for three dimension processing are the circles while for two dimension processing they are the cross symbols. The CRLB for each type of processing is plotted as the solid lines.

