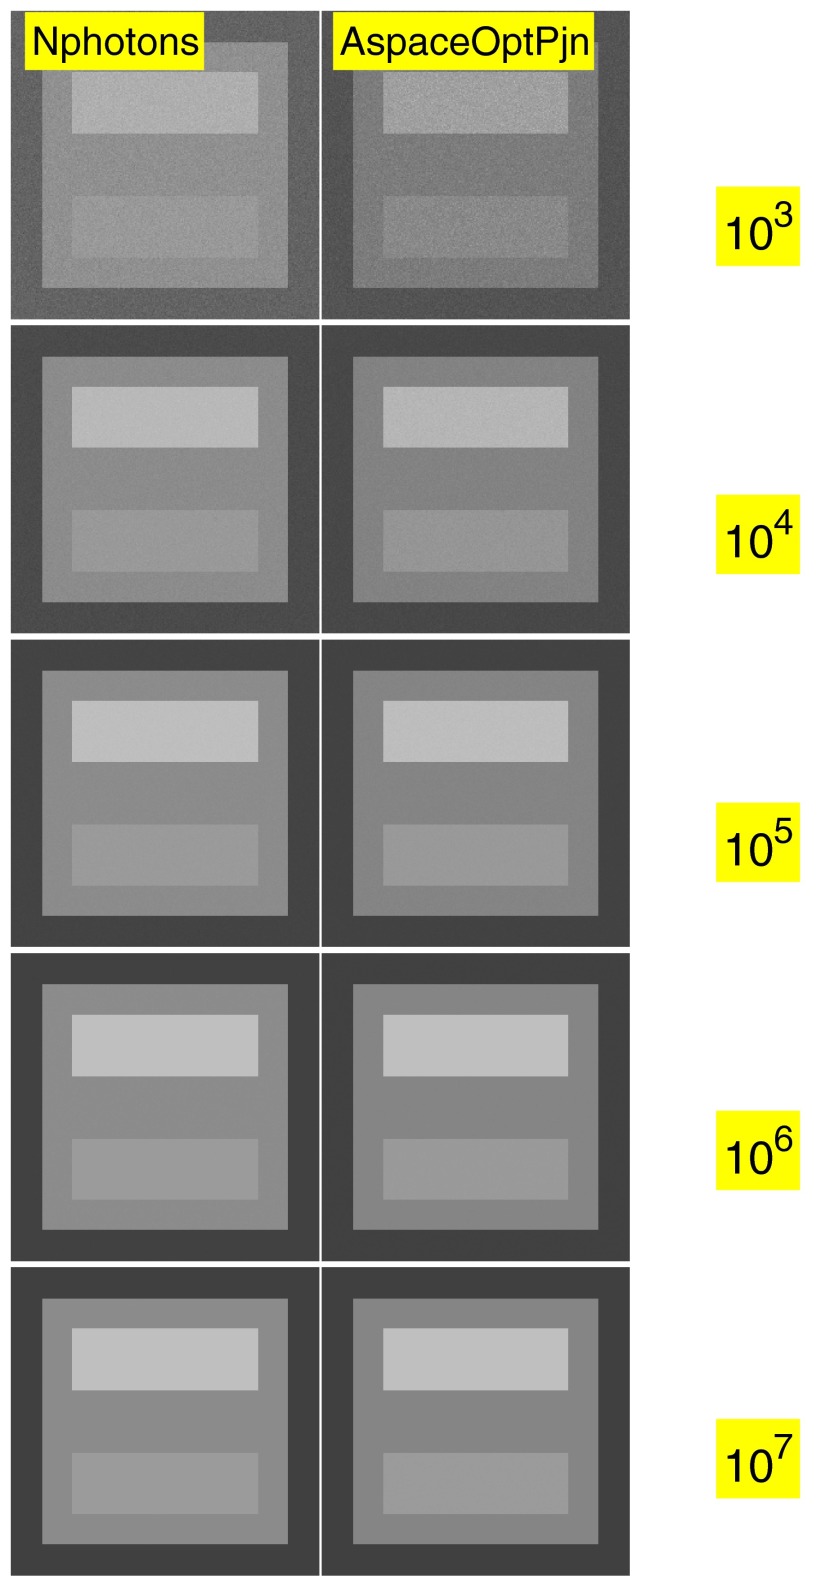
Figure 12.
Low noise images from energy selective data. The image data in the left column are the total number of photons per pixel. The data in the right column are computed from the two-dimension A-vectors by transforming so the variances of the components are equal and uncorrelated. Then a dot product is computed of the transformed A-vector in each pixel with a unit vector at an angle selected to maximize the bone contrast.

