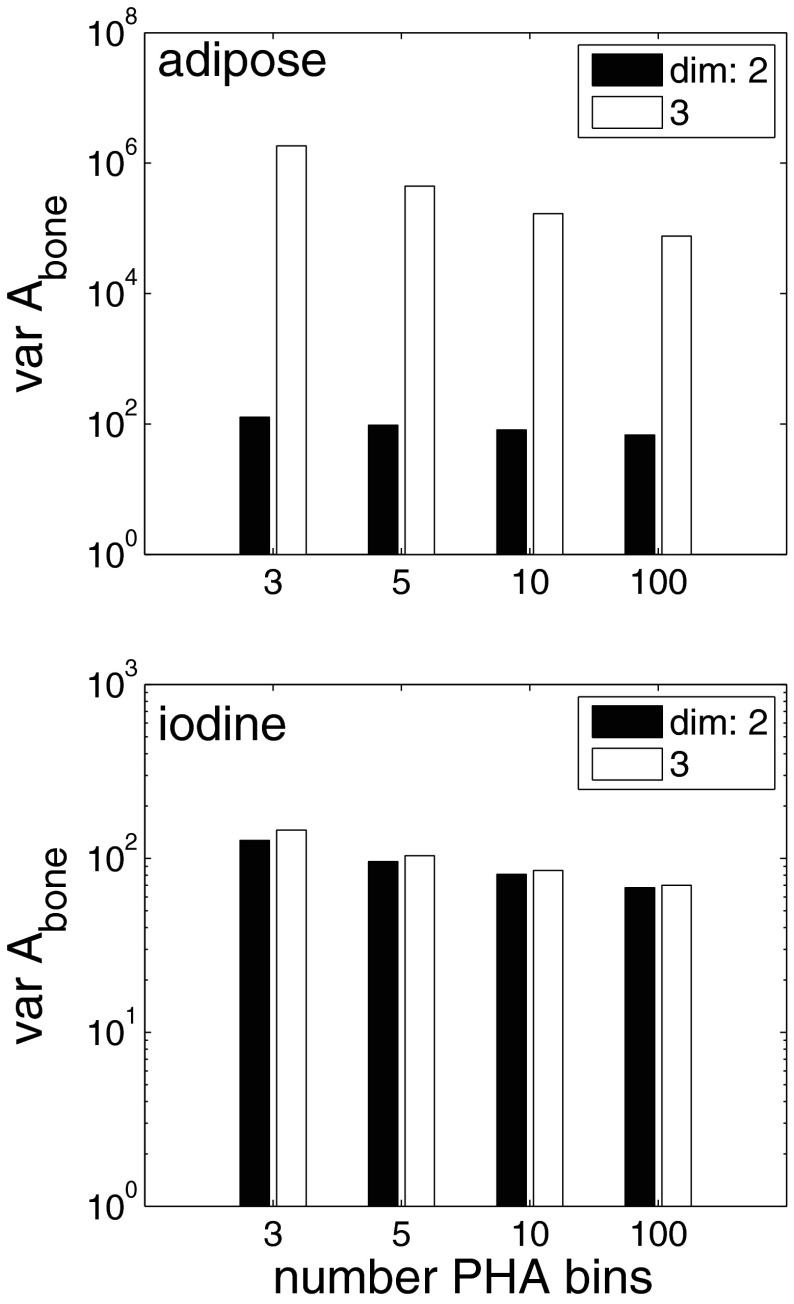
Figure 5.
Additional variance vs detector energy resolution. Plotted is the Abone variance with two and three basis functions for 3 to 100 bins PHA. In the top panel, the third basis function is the attenuation coefficient of adipose tissue while in the bottom panel it is the attenuation coefficient of one percent iodine in water. The vertical scale is logarithmic.

