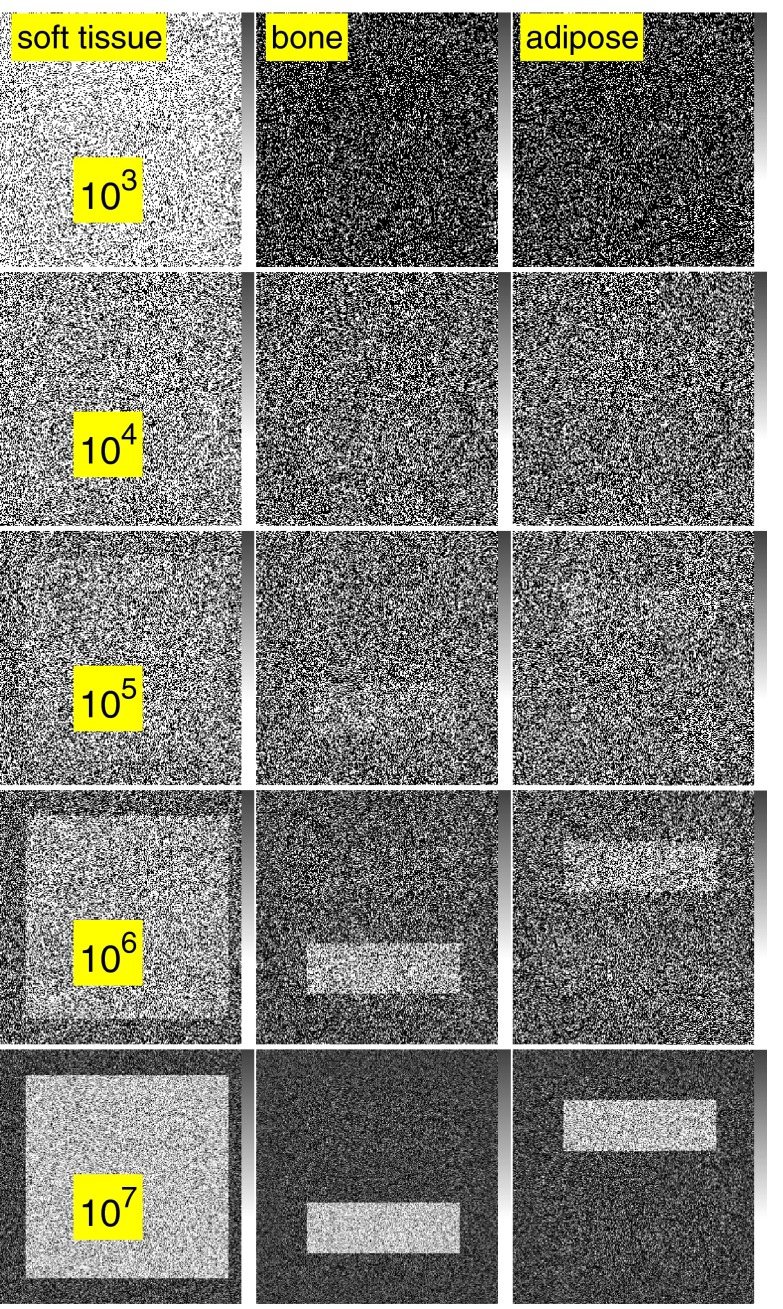
Figure 6.
Simulated images with three dimension processing when the third basis function is the attenuation coefficient of adipose tissue. A-space processing is used with 100 energy bin PHA data to compute the effective line integrals with a basis set consisting of the attenuation coefficients of soft tissue, adipose tissue, and cortical bone. The A-vector components are shown in the three columns. For each row, the spectra are multiplied by a constant so the expected number of photons per pixel increases from 103 in the top row to 107 in the bottom row. Note the gray bar at the right of each image with a range from 0 to 2.5 cm.

