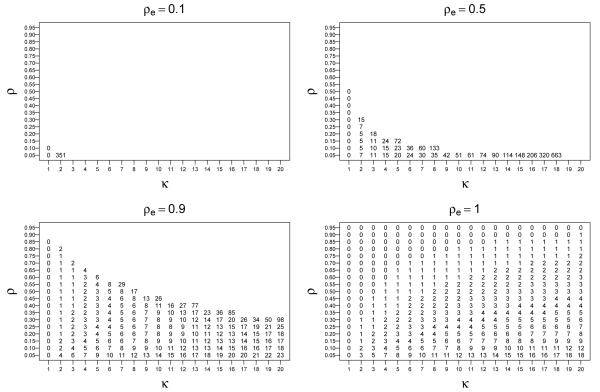
Figure 2.
Each number in the plot area indicates the optimal number of repeated measurements, ropt, under the CMD response pattern in the basic scenario, which assumes covariance structure CS(σ, θ) for the response (θ = 0), no dropout (πm = 0) and constant exposure prevalence (pej = pe, ∀j = 0, … , r). Points without label correspond to those cases in which we should make as many measurements as possible (mathematically, infinite). Results correspond to values of the ratio between the economic cost of the first measurement and one of the following ones, κ = 1, 2, … , 20, values of ρ = 0.05, 0.10, … 0.95 and values of the intraclass correlation ρe = 0.1, 0.5, 0.9 and the time-invariant exposure case, ρe = 1.

