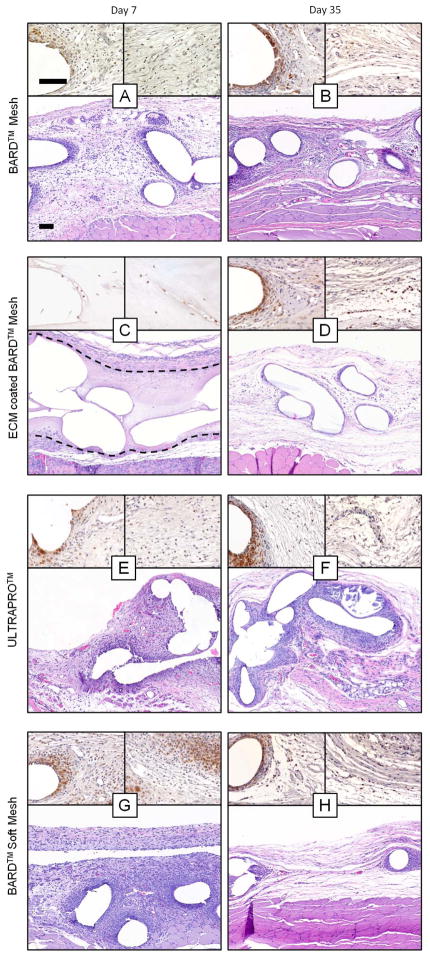
Figure 4.
Histologic appearance of mesh devices after 7 and 35 days of in vivo implantation. Representative H&E stained histologic cross sections of each mesh/time point were imaged at 100X magnification (bottom of each figure panel). Two 400X magnification images immunolabeled for the macrophage marker CD68 (brown) were focused on the area adjacent to mesh fibers (top left of each panel) and the area between mesh fibers (top right of each panel). Dotted line in C encloses the ECM coating surrounding the mesh fibers. Scale bars represents 100 μm.

