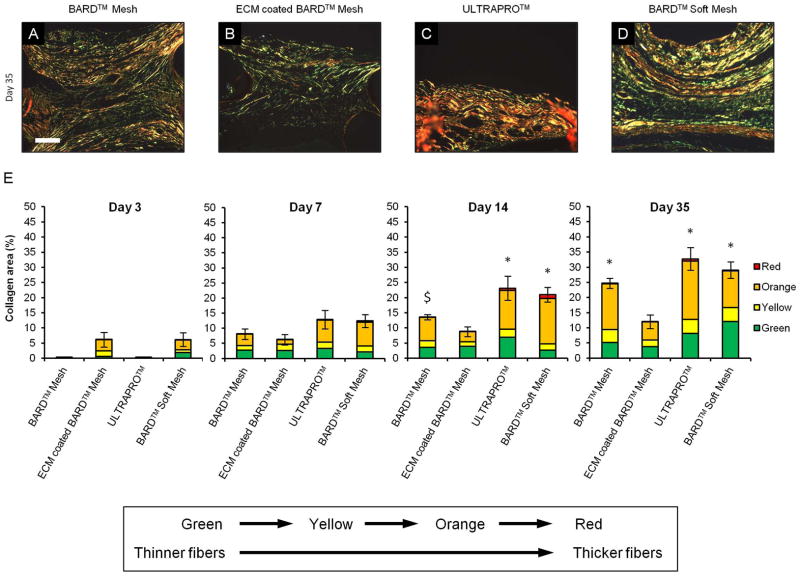
Figure 6.
Picrosirius red staining and quantification of collagen area between mesh fibers using polarized light microscopy. (A–D) Collagen fibers between the mesh fibers of each device after 35 days. The color hue of the fibers represents the relative collagen thicknesses: (in order of thinnest to thickest) green, yellow, orange, and red. (E) Quantification of the total area and proportion of collagen (defined by color hue) in each mesh after 3, 7, 14, and 35 days. Significant differences (p-value < 0.05) in total collagen content between devices within each time point are denoted: (*) as different from the ECM coated BARD™ Mesh, ($) as different from ULTRAPRO™, and (#) as different from BARD™ Soft Mesh. Scale bar represents 100 μm.

