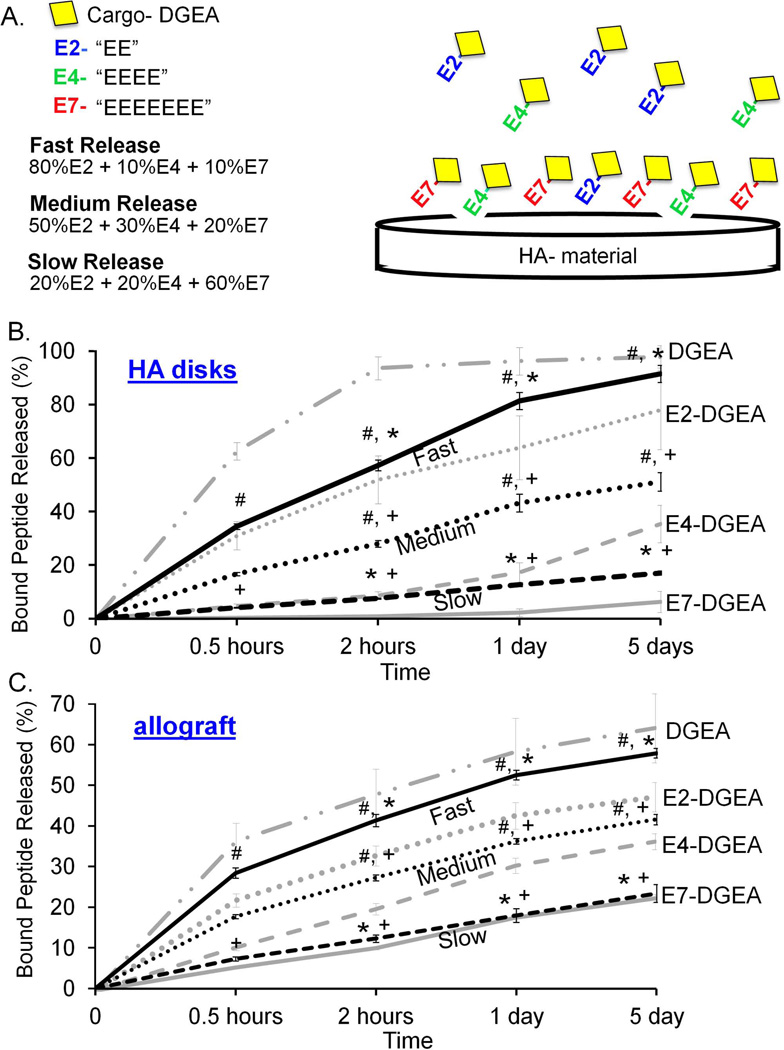
Figure 6.
Release kinetics of peptide mixtures from synthetic HA and allograft bone. (A) Peptide mixtures were generated to facilitate “fast” release= 80% E2-DGEA + 10% E4-DGEA +10% E7-DGEA, “medium” release= 50% E2-DGEA + 30% E4-DGEA + 20% E7-DGEA, and “slow” release= 20% E2-DGEA + 20% E4-DGEA + 60% E7-DGEA. These mixtures were coated onto synthetic HA disks (B) or allograft bone (C) for 2 hours, and the amount of peptide binding was quantified. Coating solutions were then aspirated and replaced with fresh TBS buffer. Release of bound peptide into TBS was monitored by measuring solution fluorescence. Data are plotted as the percent of bound peptide released. To show that the peptide mixtures exhibited distinct release kinetics as compared with pure solutions, the release profiles for 100% DGEA, E2-DGEA, E4-DGEA, and E7-DGEA are included on the graphs (light gray coloring). Significant difference (p<0.05) between fast, medium and slow samples was denoted as follows: slow=#, medium=*, and fast=+.

