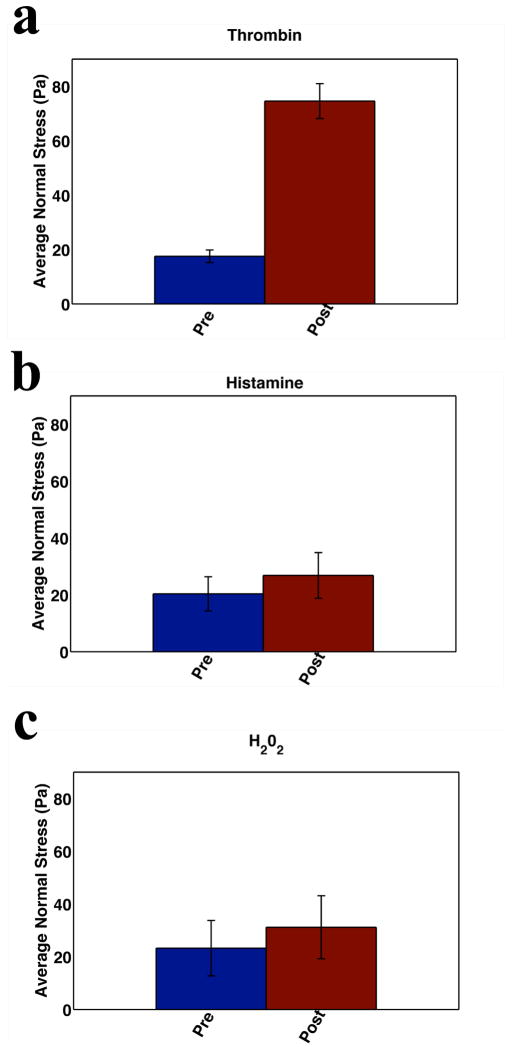
Figure 2. Barrier Disruption.
Barrier disruption is associated with an increase in cell-cell forces. Cell-cell forces are measured at baseline and the time point corresponding to maximal increase in contractile moment following agonist treatment. a HLMVEC monolayers (N=3) were treated with 0.05 U/ml thrombin and cell-cell forces were measured every 10 minutes for 1 hr. A large increase in average normal stress is demonstrated. b HLMVEC (N=2) monolayers treated with 300 μM histamine show increased average normal stress. c HLMVEC (N=3) monolayers treated with 10 μm H202 also show a rapid increase in average normal stress.

