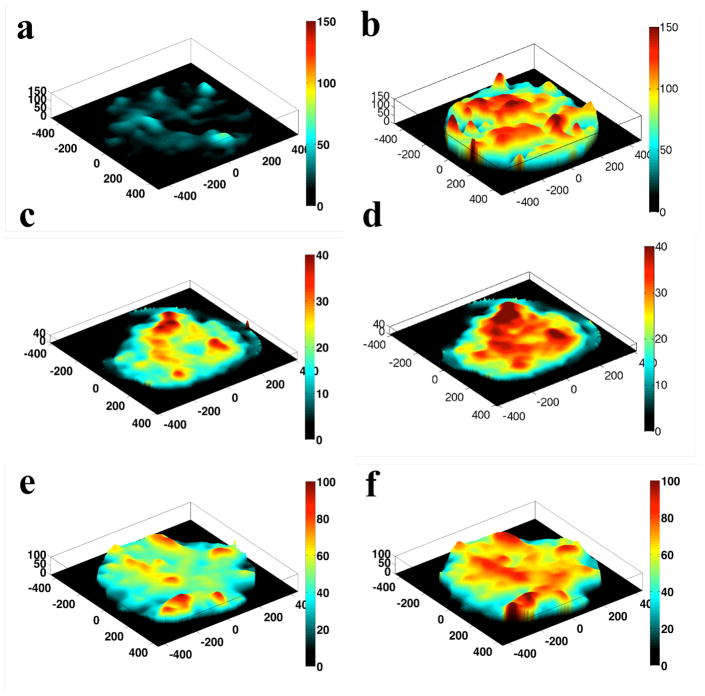
Figure 3. Stress Landscape.
There are areas of the monolayer that bear many times the average stress, and neighboring areas of the monolayer can experience drastically different stresses. The ruggedness of the landscape is enhanced with agonist treatment. a, baseline HLMVEC monolayer b. monolayer after thrombin treatment (0.05 U/ml). Note the larger scale on the z-axis compared to subsequent maps. This is necessary due to the comparatively large stresses that result form thrombin treatment. c. baseline monolayer and d. monolayer after treatment with 300 μM histamine. e. baseline monolayer and f. monolayer after treatment with 10 μM H202.

