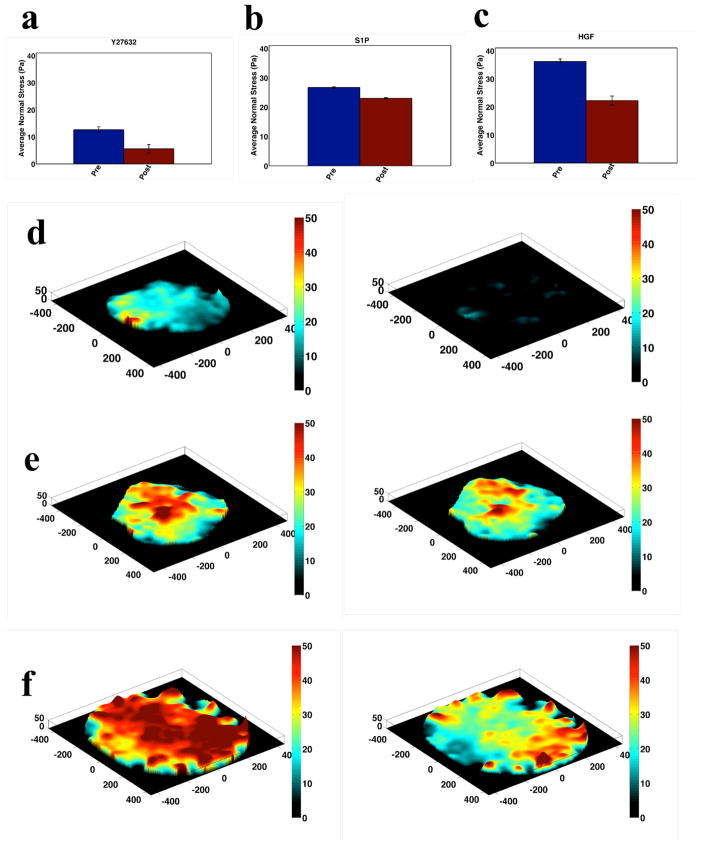
Figure 4. Mechanics of Barrier Protection.
Intercellular normal stress for HLMVEC monolayers before and after treatment with barrier protective agents 0.1 μM Y27632 (a. N=4), 1 μM S1P (b. N=2) and 100 ng/ml HGF (c. N=4). In all cases, post-treatment stresses are measured at the time point corresponding to minimal post-treatment contractile moment. Corresponding maps of local average normal stress pre and post treatment are shown for Y27632 (d), S1P (e) and HGF (f).

