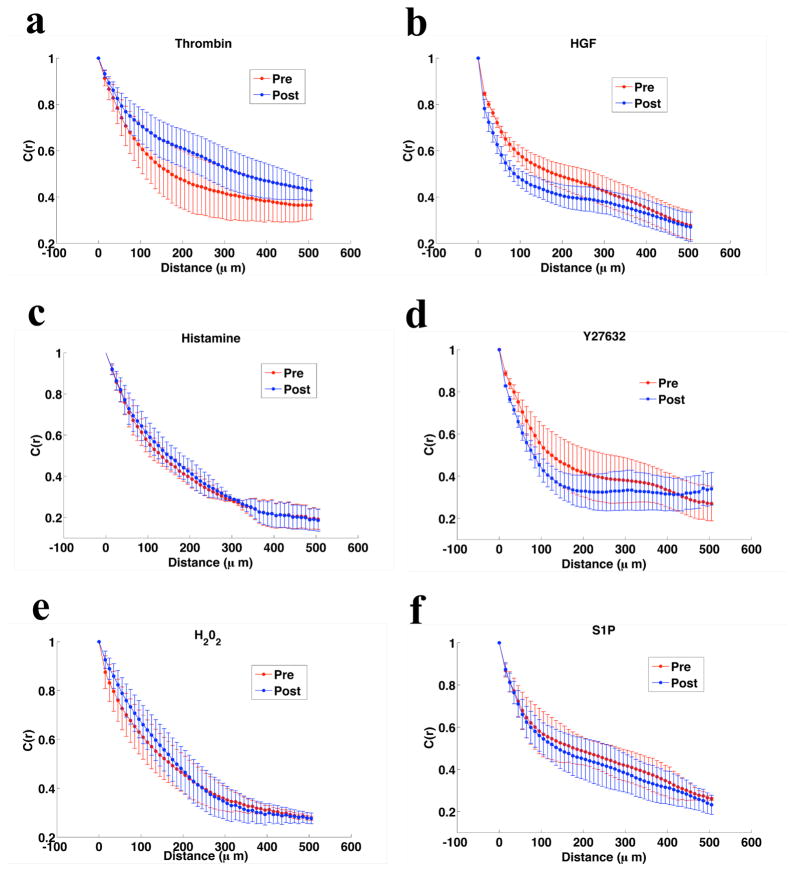
Figure 5. Effect of Barrier Modulation on Force Autocorrelation Length.
For the three barrier disrupting compounds and the three barrier protective agents C(r), the spatial autocorrelation function of the average normal stress, is calculated at baseline and at peak effect. The correlation length is increased with barrier disruption (a. Thrombin, c. Histamine, and e. H202) and decreased with barrier protection (b. HGF, d. S1P, and f. Y27632).

