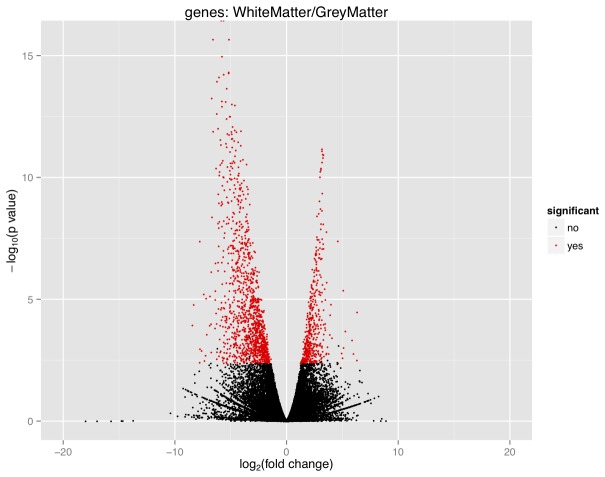
Figure 1. Volcano plot of gene expression in GM and WM.
The fold-change of the genes was relative to their expression in WM. Those genes with a negative fold-change were up-regulated in GM (down-regulated in WM) and those genes with a positive fold-change were up-regulated in WM (down-regulated in GM). Genes that were statistically significant (q-value<0.05) are shown in red and were listed in Table S1. This figure demonstrates that a larger number of genes were significantly up-regulated in GM (1218) than were up-regulated in WM (434). Overall there was a greater spread of data for the genes that are up-regulated in GM.

