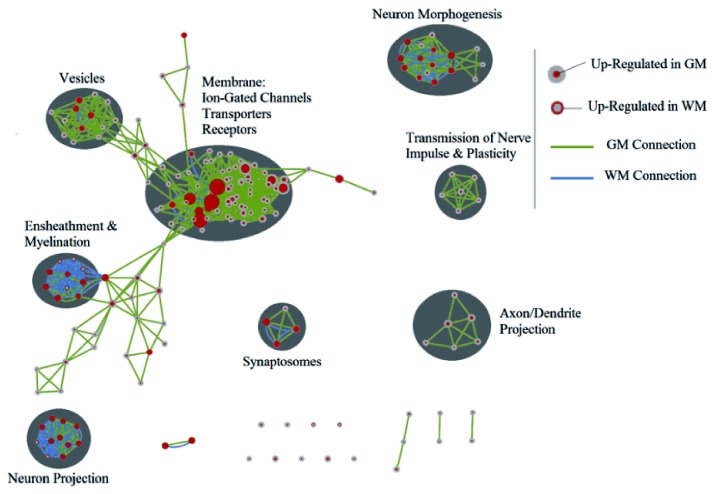
Figure 9. Gene Ontology terms enrichment map for GM and WM transcriptomes.
Each node represents a different GO term, the size of the node relates to the level of enrichment of each term. Red in the centre of the node represents up-regulation in GM, red on the edge of the node represents up-regulation in WM. The connections between each GO term are either green or blue. A green connection between node means that the both GO terms are in the GM lists, blue connections represent appearance of the GO terms in the WM lists. The more closely related GO terms are, the closer they appear on the enrichment map. A large number of closely related GO terms forms a cluster. Each cluster has been labelled with a general terms that captures all GO terms.

