
Fig. 3.
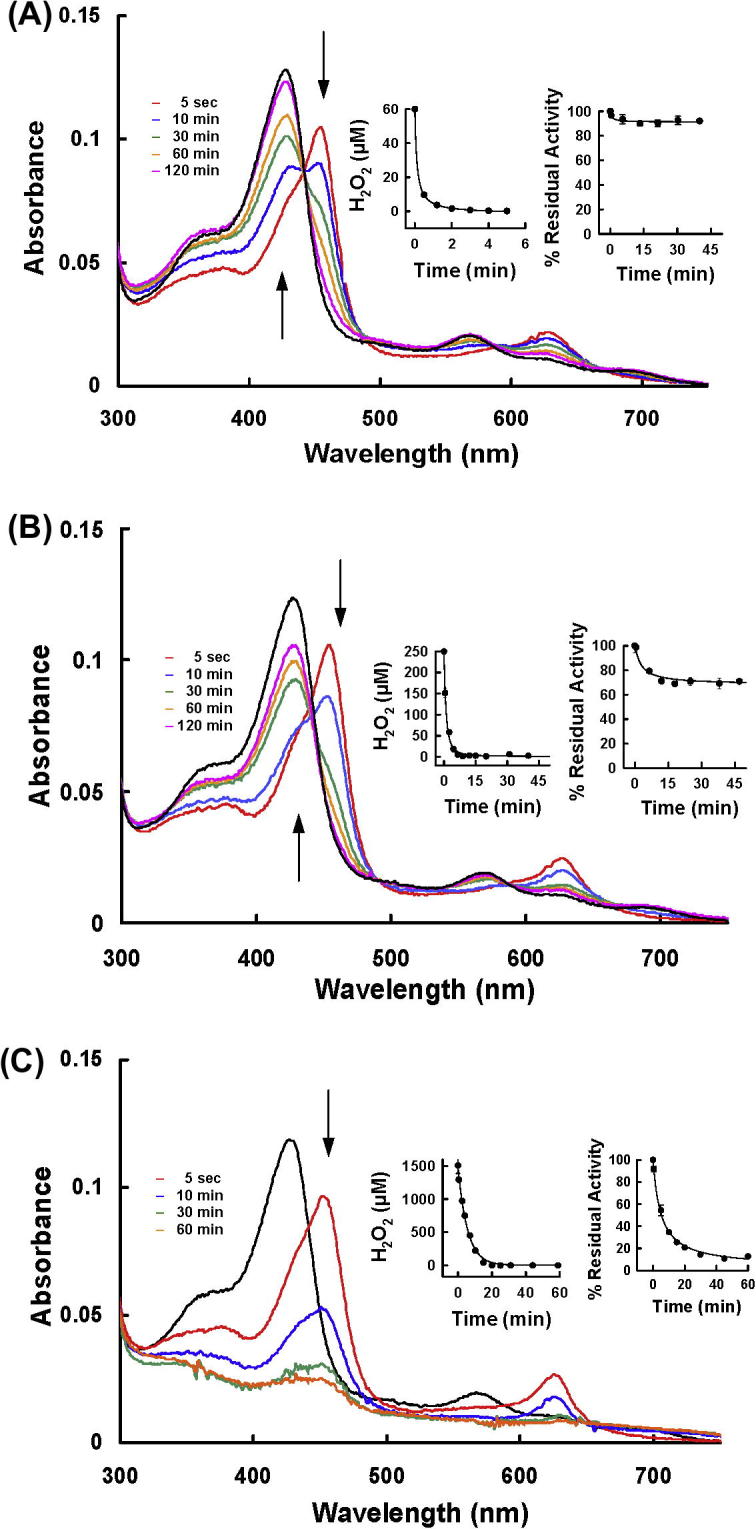
Spectral analysis of MPO reacting with hydrogen peroxide. 1.5 μM MPO was incubated with 60 μM H2O2 (A), 250 μM H2O2 (B) and 1.5 mM H2O2 (C) in 50 mM phosphate buffer, pH 7.4, 100 μM DTPA. Time resolved spectra were recorded over time. The black spectrum depicts the spectral signature of ferric MPO before addition of H2O2, arrows indicate direction of spectral changes. Insets represent consumption of hydrogen peroxide over time as measured by the FOX assay as well as the residual peroxidase activity determined with the TMB-assay.