. 2013 Oct 29;2:e01236. doi: 10.7554/eLife.01236

Figure 4. Unbiased and targeted quantitative proteomics reveals abundance changes in a small subset of proteins.

(A) Example mass spectra demonstrating both m/z peaks used for peptide sequencing and iTRAQ reporter ion signal to measure relative abundance across time points. (B) Hierarchical clustering heat map of paired mRNA and ribosome footprint relative read density vs 0 hr with relative iTRAQ protein abundance for 2572 proteins. (C) Inset of heat map for proteins increased in relative abundance by >50% at ≥2 time points shows few proteins are measurably produced during bortezomib-induced apoptosis. (D) Targeted selected reaction monitoring (SRM) assays orthogonally validate iTRAQ data for 152 proteins. In this representative data, each colored trace monitors the intensity of a given parent and fragment ion pair, as demarcated in the peptide sequence; multiple co-eluting peaks positively identify a targeted peptide. (E) Protein abundance measured by both SRM and iTRAQ demonstrate strong correlation across time points (r = 0.80).

DOI: http://dx.doi.org/10.7554/eLife.01236.016

Figure 4—source data 1. Proteomic data.
iTRAQ proteomic data organized at the protein (A) and peptide (B) level for 2686 proteins. All proteins included had a minimum of two unique peptides mapping to the protein; all peptides showed minimum iTRAQ reporter ion intensity of 300 cps at 0 hr. (C) iTRAQ proteomic data matched by UniProt Accession number to genes tracked in mRNA and footprint data across the time course. (D) List of proteins identified by iTRAQ proteomics but not present in analyzed genes from RNA deep sequencing. (E) List of parent and fragment ion transitions used for all peptides in SRM validation of iTRAQ data. (F) Protein and (G) peptide intensity data for targets tracked in SRM assay.
elife01236s003.xlsx (7.6MB, xlsx)
DOI: 10.7554/eLife.01236.017

Figure 4.

Figure 4—figure supplement 1. Protein abundance comparison.

Figure 4—figure supplement 1.

Frequency distribution of protein abundance monitored by iTRAQ proteomics (∼2700 proteins) and ribosome profiling (∼5700 proteins) compared to average cellular protein abundance as estimated in PaxDB (www.pax-db.org). We note that both distributions examine similar portions of the proteome, though the iTRAQ demonstrates greater coverage of higher abundance proteins.
Figure 4—figure supplement 2. Comparison of baseline (0 hr) read density of mRNA transcripts vs number of identified peptides mapping to each protein in iTRAQ proteomics.

Figure 4—figure supplement 2.

We find a weak but positive correlation (R = 0.27, p<0.0001). This distribution is comparable to the relationship between absolute transcript and protein copies at baseline in Figure 5—figure supplement 2.
Figure 4—figure supplement 3. Relative 5′ UTR translation across the time course for upregulated genes.

Figure 4—figure supplement 3.

Relative 5′ UTR translation (measured as normalized footprint read density in 5′ UTR vs normalized footprint read density in coding sequence) over the time course for selected genes (A) upregulated at the mRNA and footprint level and also increased by iTRAQ proteomics and (B) upregulated at the mRNA and footprint level with no detected change by iTRAQ. We note that for both sets of genes relative 5′ UTR translation stays relatively constant during bortezomib-induced apoptosis, consistent with genome-wide analysis in Figure 3B.
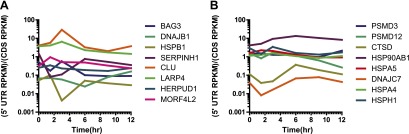
Figure 4—figure supplement 4. Unbiased and targeted proteomics comparison to deep sequencing data.

Figure 4—figure supplement 4.

Data from 150 proteins targeted in SRM assay to validate iTRAQ data. Comparison heat map of mRNA and footprint read density with iTRAQ and SRM relative protein abundance.