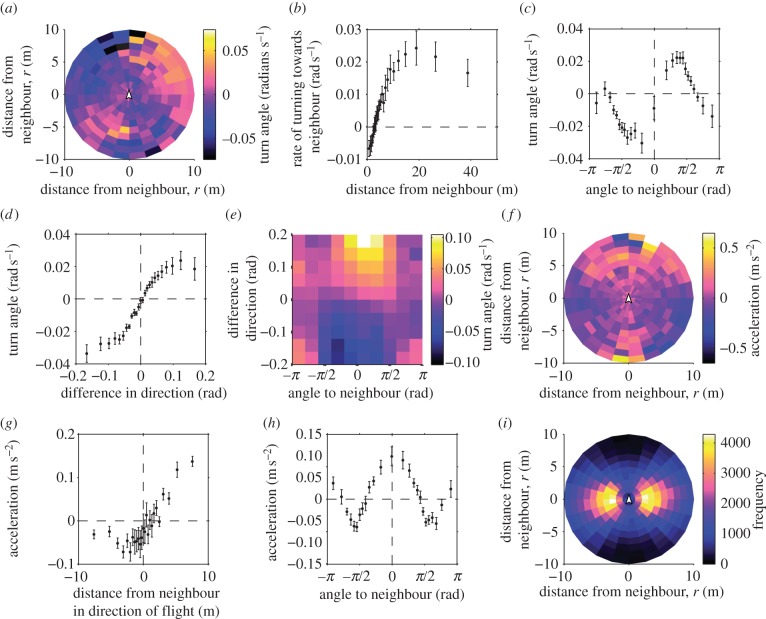
Figure 3.
‘Rules’ of flocking interaction. (a) Average turning rate of the focal bird versus the relative position of the neighbour. (In these plots, the focal bird is at the origin, facing up.) As shown in i, some bins contain very few occurrences of the neighbour and are therefore more likely to assume extreme values. (b) Distance r to the neighbour versus average rate of turning. (c) Angle θ to the neighbour versus turning rate. Positive values of θ indicate that the neighbour is on the right side; positive values of the turning angle indicate a right turn. Only neighbours at distance r > 3 m were considered in the average. (d) Alignment response of the focal bird versus difference of orientation to the neighbour φ. (e) Alignment response of the focal bird versus angle to the neighbour θ and difference in orientation φ. (f) Average change of speed of the focal bird versus the relative position of the neighbour. (g) Average change of speed versus the projected front–back distance to the neighbour, r cos θ. Positive or negative x-axis values indicate that the neighbour was, respectively, in front or behind the focal bird. (h) Average change of speed versus angle θ to the neighbour. (i) Frequency of counts of the neighbour being in each particular bin of r and θ. Note that the bins are not of equal area. Error bars in b, c, d, g and h show the standard deviations of bin-means from 500 bootstrap replicates, created by randomly sampling the 23 birds, with replacement. (Online version in colour.)

