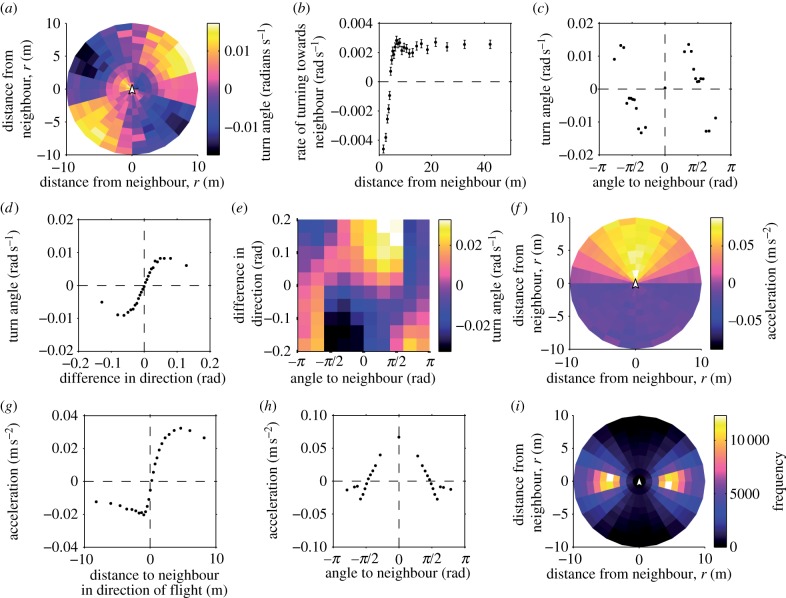
Figure 5.
‘Rules’ of flocking interaction apparent in the simulation output. (a) Average turning rate of the focal bird versus the relative position of the neighbour. (In these plots, the focal bird is at the origin, facing up.) (b) Distance r to the neighbour versus turning rate. (c) Angle θ to the neighbour versus turning rate. Positive values of θ indicate that the neighbour is on the right side; positive values of the turning rate indicate a right turn. Only neighbours at distance r > 3 m were considered in the average. (d) Alignment response of the focal bird versus difference of orientation to the neighbour φ. (e) Alignment response of the focal bird versus angle to the neighbour θ and difference in orientation φ. (f) Average change of speed of the focal bird versus relative position of the neighbour. (g) Average change of speed versus distance to the neighbour projected onto the direction of travel, r cos θ. Positive or negative x-axis values indicate that the neighbour was, respectively, in front or behind the focal bird. (h) Average change of speed versus angle θ to the neighbour. (i) Frequency of counts of the neighbour's occurrence in each particular bin of r and θ. Note that the bins are not of equal area. Error bars in b, c, d, g and h (often smaller than symbol size) show standard errors based on the number of points in each bin. (Online version in colour.)

