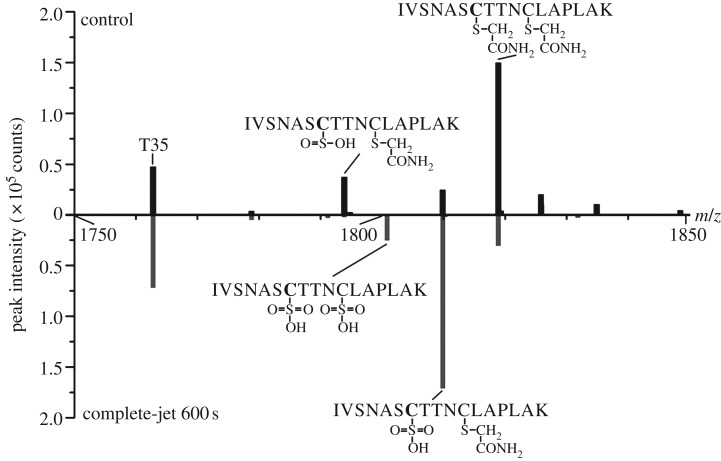
Figure 5.
Mass spectrometry reveals oxidation of the catalytic cysteine of glyceraldehyde 3-phosphate dehydrogenase. The mirror plot shows sections of the deisotoped mass spectrum of the control (top) and the spectrum of GAPDH treated for 600 s with the complete-jet (bottom). Peaks identified as tryptic peptides containing the catalytic Cys150 (bold) are annotated with their sequence and modifications. T35: tryptic peptide number 35 of GAPDH, also found in this m/z range.

