Figure 1.
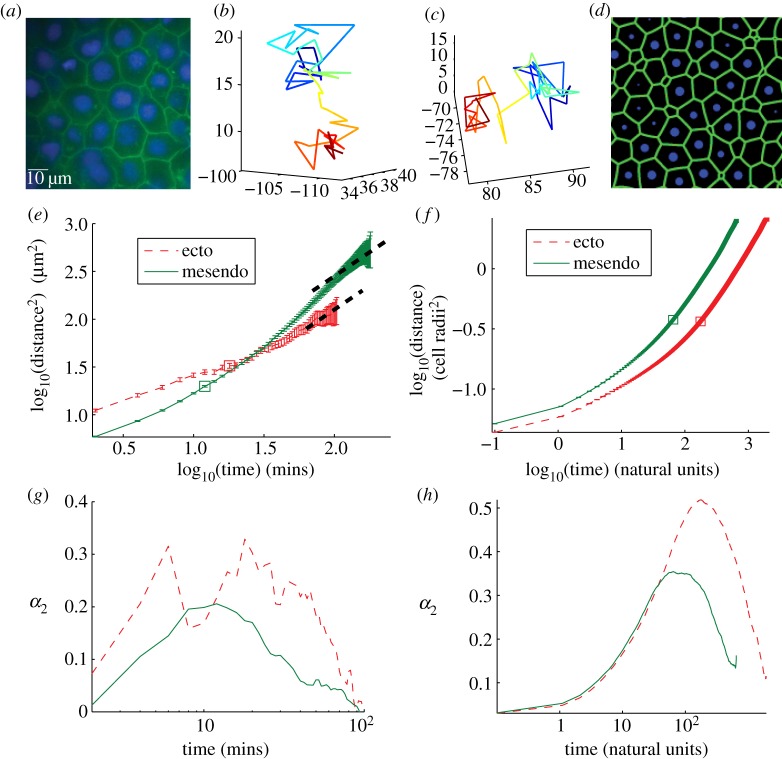
(a) Two-dimensional cross section of three-dimensional experimental tissue showing packing fraction unity. Cell membranes are labelled using Gap43GFP, cell nuclei using Hoechst. (b,c) Two sample cell tracks extracted from experimental data illustrating ‘caging’ behaviour as described in the text. (d) Two-dimensional cross section of three-dimensional tissue simulation, interfaces generated using a Voronoi tessellation and the surface evolver computer program [34]. (e) MSD data for experimental ectoderm (thin dashed) and mesendoderm (solid) explants. Thick dashed lines are slope 1, drawn to guide the eye. (f) MSD data for best-fit simulation parameters shown in natural units as discussed in the electronic supplementary material text. (g,h) Non-Gaussian parameter (described in text) for experimental (g) and best-fit simulation (h) data achieve a maximum at a timescale tc discussed in the main text. Secondary peak at very short timescales for ectoderm data is likely caused by misidentified features. (Online version in colour.)

