
Figure 4.
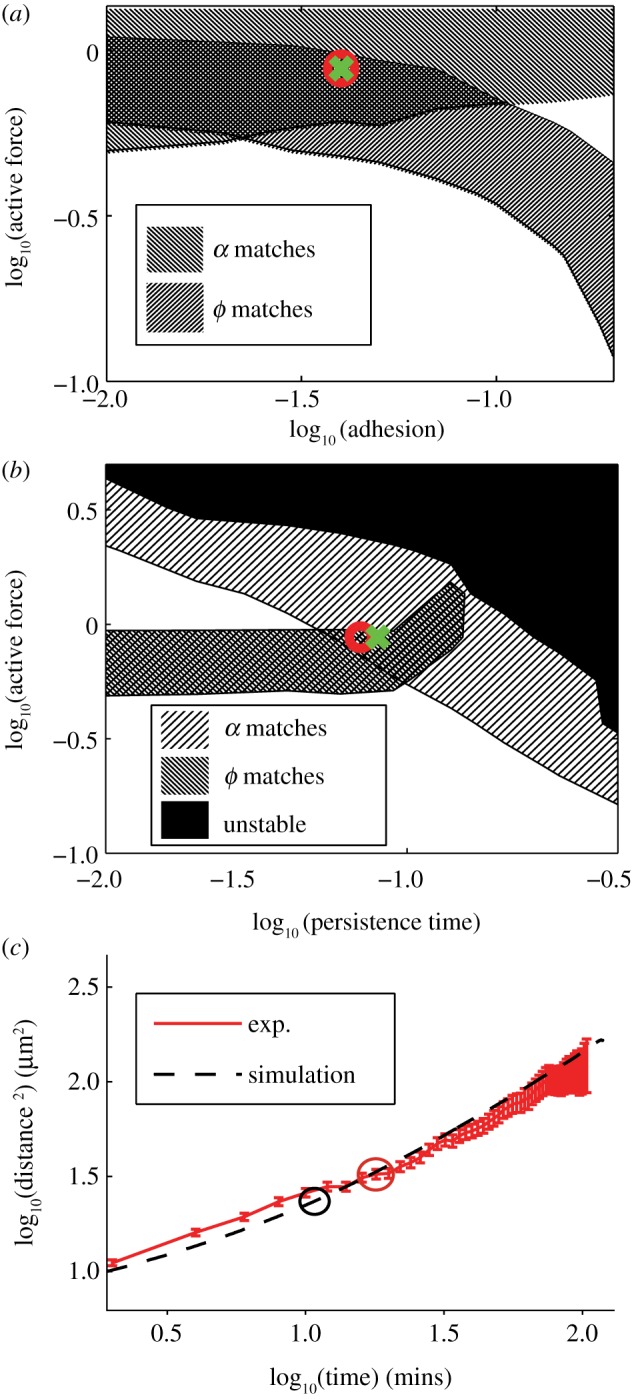
Calibrating the model. (a) Simulation phase diagram for active force and adhesion parameters. Circle and cross show best-fit parameters for ectoderm and mesendoderm, respectively. (b) Phase diagram for active force and persistence time model parameters. (c) Comparison of MSD for ectoderm explants compared to best-fit parameter from simulations. (Online version in colour.)