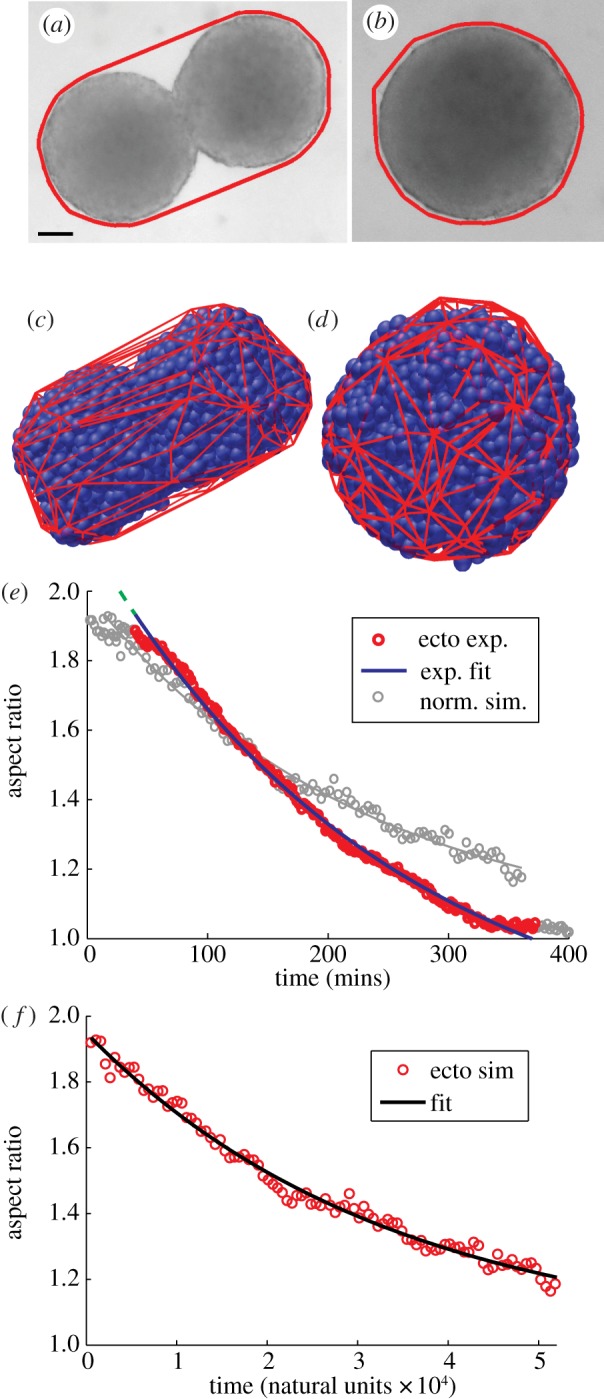
Figure 7.

(a,b) Images from the beginning and end of experimental aggregate fusion. Thick line indicates convex hull. Scale bar, 100 mm. (c,d) Images from beginning and end of simulation of aggregate fusion. (e) Experimental data for AR as a function of time (dark circles) and fit (dark line). Light circles and line correspond to simulation data that have been normalized to account for different aggregate size and surface tension as measured by the TST simulations. (f) Simulation data for AR as a function of time (circles) and fit (solid line). (Online version in colour.)
