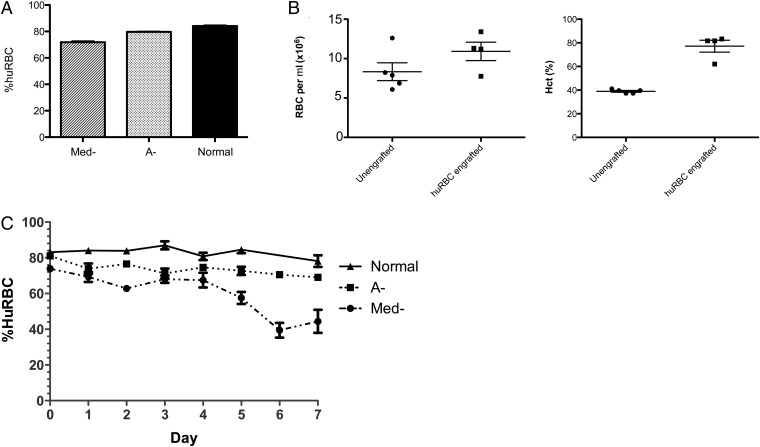
Fig. 1.
Engraftment of Med-, A-, and normal huRBCs in NOD/SCID mice. (A) Mice were engrafted with huRBCs from Med-, A-, and normal donors, n = 99, 242, and 40, respectively in 5, 12, and 2 separate experiments. Mice received 5 × 10⁹ red blood cells i.p. for 14 d and were assessed for levels of huRBCs at day 14 by FACS staining using an anti-CD235a FITC-conjugated monoclonal antibody. The graph shows the engraftment efficiency after 14 d in Med-, A-, and normal mice. Values are % mean huRBCs ± SEM. (B) Comparison of total RBCs and hematocrit in huRBC SCID mice. The number of RBCs per μL of blood was determined, as well as the hematocrit in NOD/SCID mice (unengrafted) and in NOD/SCID given huRBCs for 14 d (n = 5 and 4, respectively). Dots represent individual mice. (C) Stability of engrafted Med-, A-, and normal huRBCs in NOD/SCID mice was assessed over 7 d after the last injection of huRBCs. n = 18, 43, and 10 mice from Med-, A-, and normal huRBC SCID mice from 5, 12, and 2 independent experiments, respectively. Data points shown are the mean ± SEM.

