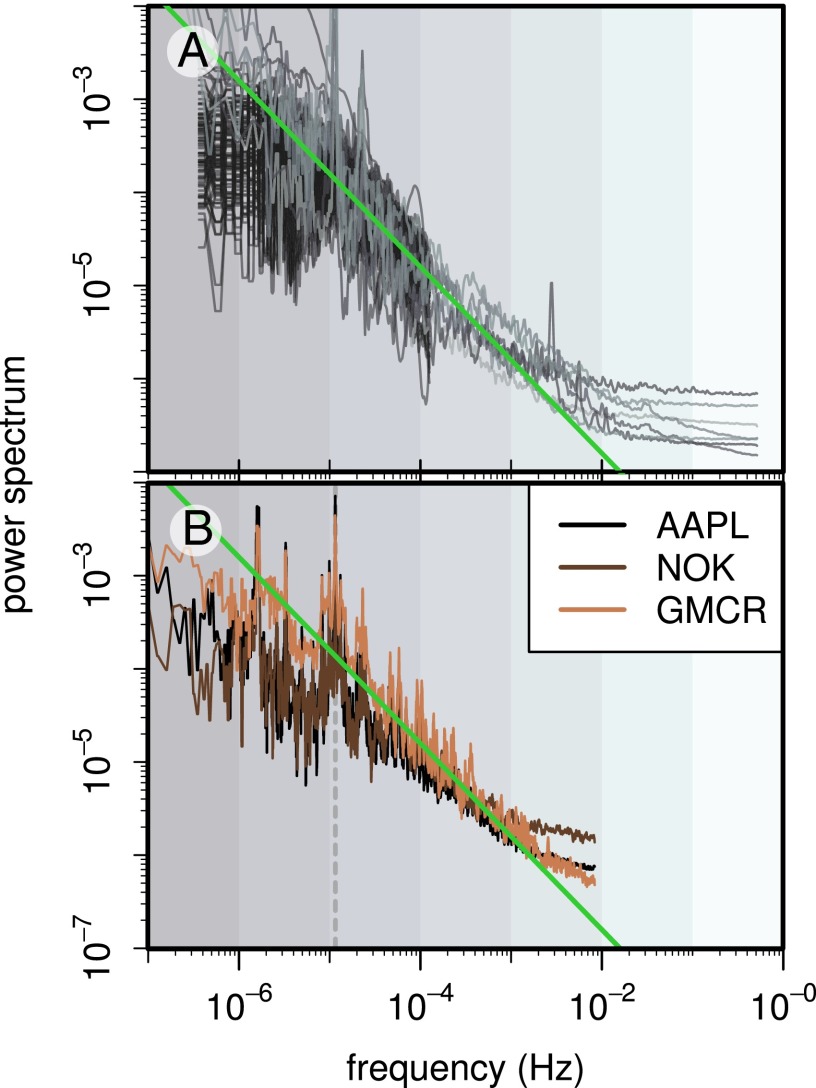
Fig. 3.
Power spectra of the activity rates  for the individual brands in SI Text (A) and stocks (B). For high frequencies 0.1–24 h−1, the spectra have a characteristic
  behavior with a crossover to white noise at very high frequencies. The green line is a guide to the eye and corresponds to a
  behavior.

