
Fig. 5.
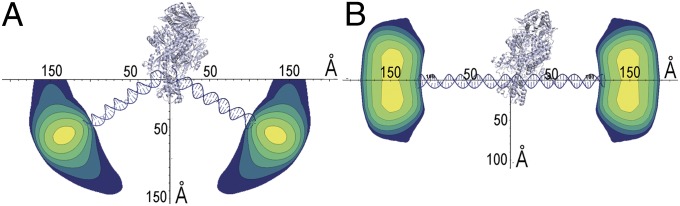
Mismatch DNA bending by MutS and straightening in the presence of ATP. Contour plots of the distribution of DNA ends are visualized by placing the structural information from the crystal structure of MutS/DNA (2) on the same scale as the distance and population information from the P(Dij) distributions. The P(Dij) distributions from 71-bp DNA in the presence of MutS (A) and the presence of MutS and excess ATP (B) set contour levels. The widest part of the distribution is the width of the gold nanocrystal. DNA of the crystal structure has been extended to 71 bp for the MutS/DNA complex and replaced by straight DNA for the ATP model.