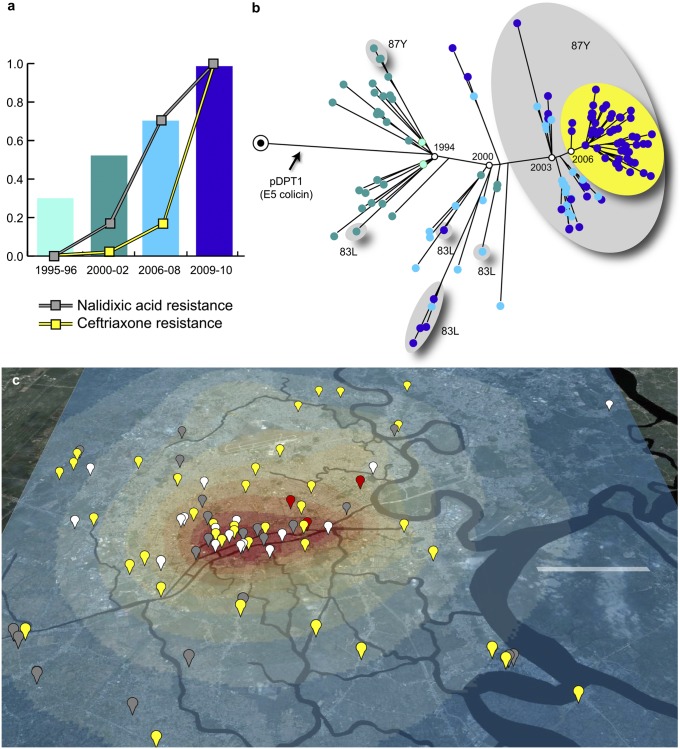
Fig. 2.
The dynamics of S. sonnei microevolution in HCMC. (A) Bars indicate the frequency of S. sonnei isolated in HCMC as a proportion of total culture-confirmed Shigellosis cases; line plots indicate the proportion of S. sonnei resistant to nalidixic acid and ceftriaxone. (B) Phylogenetic tree for HCMC S. sonnei isolates, showing estimated dates for major sweeps, acquisition of pDPT1 colicin plasmid, and fixation of key nalidixic resistance mutations (gray groups) and pKHSB1 plasmid conferring resistance to third-generation cephalosporins (yellow group). (C) North-orientated map of central HCMC, with highlighted waterways, showing the GPS locations of 53 S. sonnei patient residences identified between 2009 and 2010 (gray, sweep 3/gyrA-87Y; yellow, sweep 4/gyrA-87Y/CTX-M-15; white, presweep 3). Heat map indicates the spatial distribution of 1,419 diarrheal disease episodes in HCMC; colors of the heat map indicate the probability of all-cause diarrhea per 0.02 km2, ranging from 2 × 10⁻⁶ (dark blue) up to 1.67 × 10⁻⁴ (red). (Scale bar: 5 km.)

