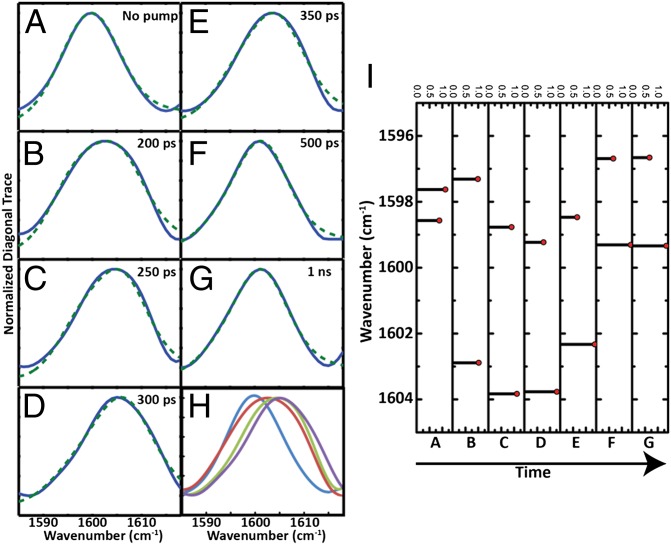
Fig. 3.
Exciton modeling of S,S-Tet-AKAC10*/A11* in d3-TFE. (Left) Normalized diagonal 2D IR trace (blue) and the fitting to the exciton model (dotted green) (A) with no optical pump and (B) 200 ps, (C) 250 ps, (D) 300 ps, (E) 350 ps, (F) 500 ps, and (G) 1 ns after release. (H) Overlay of normalized diagonal 2D IR traces for (blue) A, (red) B, (green) C, and (purple) D. (I) The peak position and relative intensity from the exciton model fitting of diagonal 2D IR traces for conditions A through G, with delay time increasing as shown.

